

carbon, organic matter and nitrogen. The interrelationships between the remaining
soil properties were also significant (determination coefficients (R
2 ) ¼ 0.4–0.5)
(Ostrowska and Sienkiewicz 2011). It was determined that the loss of soil carbon
of a range of 1 % results in changes in the remaining soil properties, e.g. the peat
soil MWHC is lowered by about 2 %, while the N content and CEC – by more than
1 %. Consequently, it can be assumed that soil carbon content is an integrative
indicator of climate change, validated against the remaining soil properties and
thus, indirectly, against other habitat properties such as vegetation type, species
composition, presence of invasive species etc. Likewise, the changes in the contents
of carbon and nitrogen and their water soluble forms as well as those of soil solution
concentrations were found to correlate with the dynamics of precipitation and
temperature over several last decades (Ostrowska and Sienkiewicz 2011). Therefore, the soil carbon content may be applied as basic metric providing information
on long-term changes in peat soils in an integrative way. In addition, accelerated
SOM mineralisation results in the increased migration of nitrogen to the soil
environment. Change in the content of soil nitrogen, and of its mineral form in
particular, constitutes the basic indicator of the above process. This indicator
evaluates the rate of SOM mineralisation process at a given moment of time, thus
it may be applied as a short term indicator. In addition, the concentration and
composition of soil solutions reflect both the rate of SOM mineralisation and the
vulnerability of wetland habitat to the invasion of plant species having a high
nutrient demand, especially of expansive and alien invasive species (Ostrowska
and Sienkiewicz 2011).
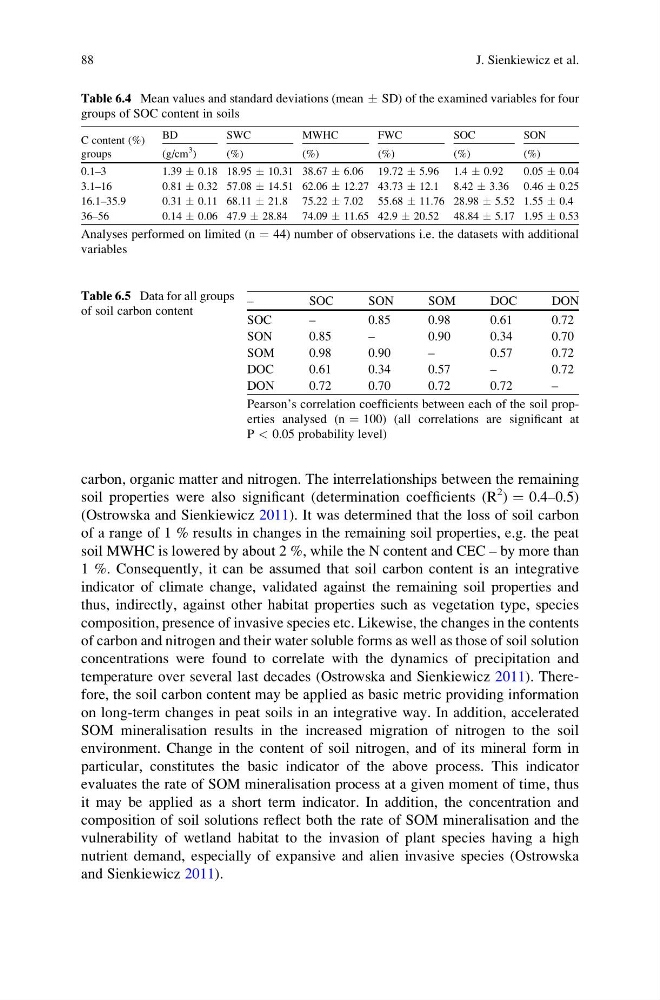
Table 6.4 Mean values and standard deviations (mean Æ SD) of the examined variables for four
groups of SOC content in soils
C content (%)
groups
BD
SWC
MWHC
FWC
SOC
SON
(g/cm
3
)
(%)
(%)
(%)
(%)
(%)
0.1–3
1.39 Æ 0.18 18.95 Æ 10.31 38.67 Æ 6.06 19.72 Æ 5.96 1.4 Æ 0.92
0.05 Æ 0.04
3.1–16
0.81 Æ 0.32 57.08 Æ 14.51 62.06 Æ 12.27 43.73 Æ 12.1 8.42 Æ 3.36 0.46 Æ 0.25
16.1–35.9
0.31 Æ 0.11 68.11 Æ 21.8 75.22 Æ 7.02 55.68 Æ 11.76 28.98 Æ 5.52 1.55 Æ 0.4
36–56
0.14 Æ 0.06 47.9 Æ 28.84 74.09 Æ 11.65 42.9 Æ 20.52 48.84 Æ 5.17 1.95 Æ 0.53
Analyses performed on limited (n ¼ 44) number of observations i.e. the datasets with additional
variables
Table 6.5 Data for all groups
of soil carbon content
–
SOC
SON
SOM
DOC
DON
SOC
–
0.85
0.98
0.61
0.72
SON
0.85
–
0.90
0.34
0.70
SOM
0.98
0.90
–
0.57
0.72
DOC
0.61
0.34
0.57
–
0.72
DON
0.72
0.70
0.72
0.72
–
Pearson’s correlation coefficients between each of the soil properties analysed (n ¼ 100) (all correlations are significant at
P < 0.05 probability level)
88
J. Sienkiewicz et al.
soil properties were also significant (determination coefficients (R
2 ) ¼ 0.4–0.5)
(Ostrowska and Sienkiewicz 2011). It was determined that the loss of soil carbon
of a range of 1 % results in changes in the remaining soil properties, e.g. the peat
soil MWHC is lowered by about 2 %, while the N content and CEC – by more than
1 %. Consequently, it can be assumed that soil carbon content is an integrative
indicator of climate change, validated against the remaining soil properties and
thus, indirectly, against other habitat properties such as vegetation type, species
composition, presence of invasive species etc. Likewise, the changes in the contents
of carbon and nitrogen and their water soluble forms as well as those of soil solution
concentrations were found to correlate with the dynamics of precipitation and
temperature over several last decades (Ostrowska and Sienkiewicz 2011). Therefore, the soil carbon content may be applied as basic metric providing information
on long-term changes in peat soils in an integrative way. In addition, accelerated
SOM mineralisation results in the increased migration of nitrogen to the soil
environment. Change in the content of soil nitrogen, and of its mineral form in
particular, constitutes the basic indicator of the above process. This indicator
evaluates the rate of SOM mineralisation process at a given moment of time, thus
it may be applied as a short term indicator. In addition, the concentration and
composition of soil solutions reflect both the rate of SOM mineralisation and the
vulnerability of wetland habitat to the invasion of plant species having a high
nutrient demand, especially of expansive and alien invasive species (Ostrowska
and Sienkiewicz 2011).
Table 6.4 Mean values and standard deviations (mean Æ SD) of the examined variables for four
groups of SOC content in soils
C content (%)
groups
BD
SWC
MWHC
FWC
SOC
SON
(g/cm
3
)
(%)
(%)
(%)
(%)
(%)
0.1–3
1.39 Æ 0.18 18.95 Æ 10.31 38.67 Æ 6.06 19.72 Æ 5.96 1.4 Æ 0.92
0.05 Æ 0.04
3.1–16
0.81 Æ 0.32 57.08 Æ 14.51 62.06 Æ 12.27 43.73 Æ 12.1 8.42 Æ 3.36 0.46 Æ 0.25
16.1–35.9
0.31 Æ 0.11 68.11 Æ 21.8 75.22 Æ 7.02 55.68 Æ 11.76 28.98 Æ 5.52 1.55 Æ 0.4
36–56
0.14 Æ 0.06 47.9 Æ 28.84 74.09 Æ 11.65 42.9 Æ 20.52 48.84 Æ 5.17 1.95 Æ 0.53
Analyses performed on limited (n ¼ 44) number of observations i.e. the datasets with additional
variables
Table 6.5 Data for all groups
of soil carbon content
–
SOC
SON
SOM
DOC
DON
SOC
–
0.85
0.98
0.61
0.72
SON
0.85
–
0.90
0.34
0.70
SOM
0.98
0.90
–
0.57
0.72
DOC
0.61
0.34
0.57
–
0.72
DON
0.72
0.70
0.72
0.72
–
Pearson’s correlation coefficients between each of the soil properties analysed (n ¼ 100) (all correlations are significant at
P < 0.05 probability level)
88
J. Sienkiewicz et al.