

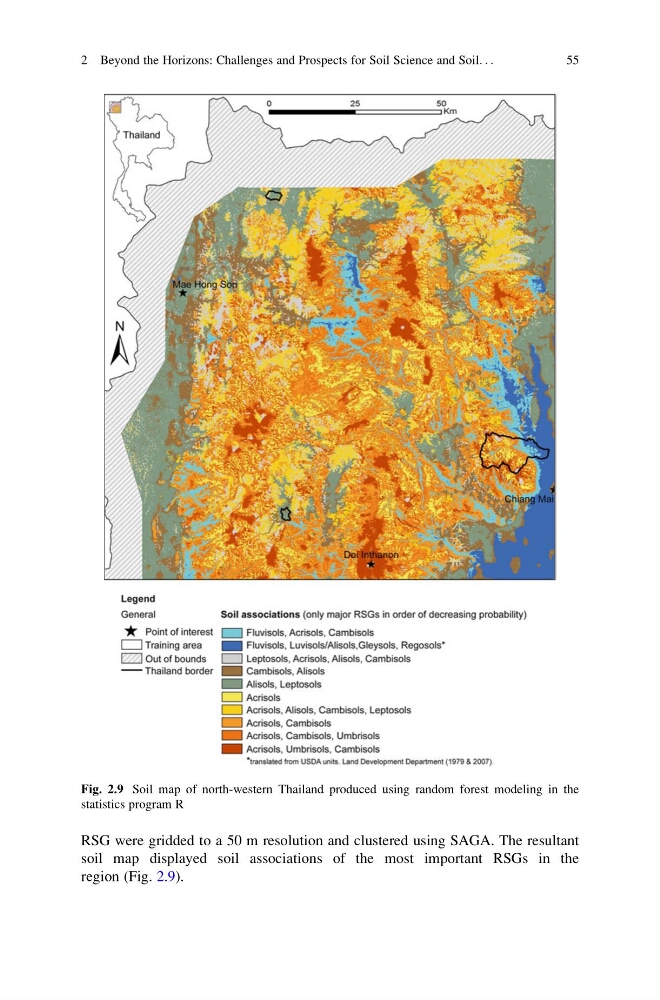
RSG were gridded to a 50 m resolution and clustered using SAGA. The resultant
soil map displayed soil associations of the most important RSGs in the
region (Fig. 2.9).
Fig. 2.9 Soil map of north-western Thailand produced using random forest modeling in the
statistics program R
2 Beyond the Horizons: Challenges and Prospects for Soil Science and Soil. . .
55
soil map displayed soil associations of the most important RSGs in the
region (Fig. 2.9).
Fig. 2.9 Soil map of north-western Thailand produced using random forest modeling in the
statistics program R
2 Beyond the Horizons: Challenges and Prospects for Soil Science and Soil. . .
55