

rank the different soil properties of the local soil types, covering crop suitability,
fertility, infiltration rates, erosion hazards and topsoil thickness. These indigenous
soil types were then mapped using aerial photographs, a 3D topographic model and
topographic maps as communication tools.
Scale independent mapping approaches – Maximum likelihood approach
(applied at the watershed scale): The available predictors were elevation, slope
inclination, curvature, aspect and petrography, as well as LANDSAT 7 (bands 1–8)
and SPOT 5 (bands 1–4) data. Soil types representing more than 1 % of the
respective investigation area were considered in the analysis (Schuler et al.
2010). Principal component analysis using the PAST 1.81 software was conducted
in order to reduce the number of input raster data layers, leaving those with the
highest explanatory value for the given soil data. Afterwards, the maximum likelihood approach was applied for all the major soil types, using training points and
applying the “sample function” to extract the corresponding predictors. In order to
enable reliable maximum likelihood based soil predictions, additional sampling
points were used, the number of training points being 302 in Bor Krai, 165 in Huai
Bong and 163 in Mae Sa Mai. To test whether this approach would perform well
with a reduced dataset, 25 sampling points were distributed among the local soil
units. In order to up-scale from the Mae Sa Mai training area to the whole of the
Mae Sa watershed, 31 additional training points were used, because some mapping
units did not occur within the smaller training zone, such as large water bodies and
urban areas, which instead were identified using the SPOT 5 satellite image. In the
output raster of this supervised classification, each cell was assigned to a soil type
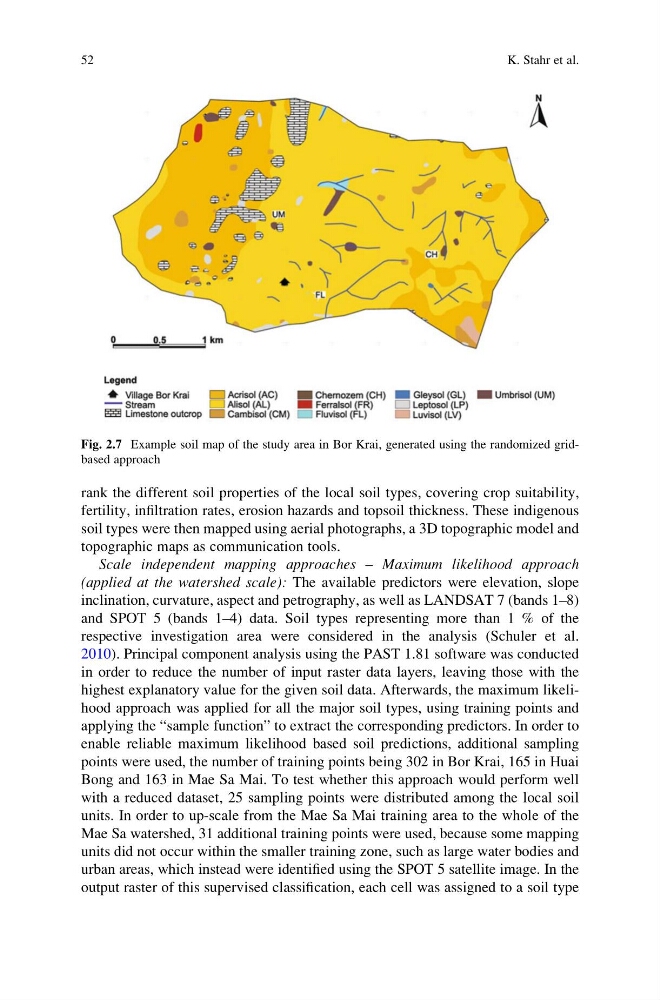
Fig. 2.7 Example soil map of the study area in Bor Krai, generated using the randomized gridbased approach
52
K. Stahr et al.
fertility, infiltration rates, erosion hazards and topsoil thickness. These indigenous
soil types were then mapped using aerial photographs, a 3D topographic model and
topographic maps as communication tools.
Scale independent mapping approaches – Maximum likelihood approach
(applied at the watershed scale): The available predictors were elevation, slope
inclination, curvature, aspect and petrography, as well as LANDSAT 7 (bands 1–8)
and SPOT 5 (bands 1–4) data. Soil types representing more than 1 % of the
respective investigation area were considered in the analysis (Schuler et al.
2010). Principal component analysis using the PAST 1.81 software was conducted
in order to reduce the number of input raster data layers, leaving those with the
highest explanatory value for the given soil data. Afterwards, the maximum likelihood approach was applied for all the major soil types, using training points and
applying the “sample function” to extract the corresponding predictors. In order to
enable reliable maximum likelihood based soil predictions, additional sampling
points were used, the number of training points being 302 in Bor Krai, 165 in Huai
Bong and 163 in Mae Sa Mai. To test whether this approach would perform well
with a reduced dataset, 25 sampling points were distributed among the local soil
units. In order to up-scale from the Mae Sa Mai training area to the whole of the
Mae Sa watershed, 31 additional training points were used, because some mapping
units did not occur within the smaller training zone, such as large water bodies and
urban areas, which instead were identified using the SPOT 5 satellite image. In the
output raster of this supervised classification, each cell was assigned to a soil type
Fig. 2.7 Example soil map of the study area in Bor Krai, generated using the randomized gridbased approach
52
K. Stahr et al.