

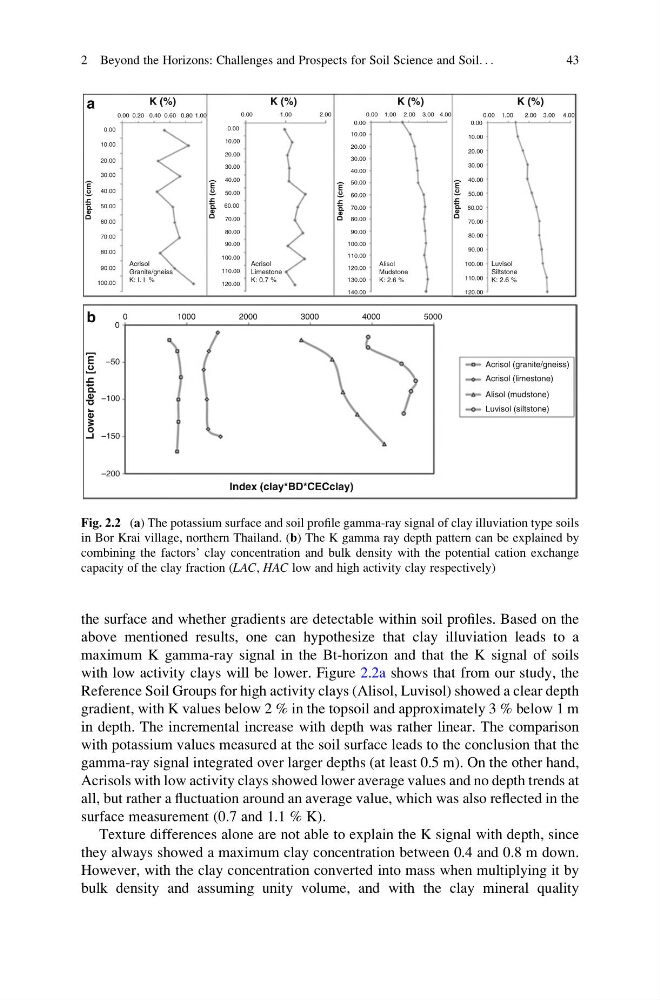
the surface and whether gradients are detectable within soil profiles. Based on the
above mentioned results, one can hypothesize that clay illuviation leads to a
maximum K gamma-ray signal in the Bt-horizon and that the K signal of soils
with low activity clays will be lower. Figure 2.2a shows that from our study, the
Reference Soil Groups for high activity clays (Alisol, Luvisol) showed a clear depth
gradient, with K values below 2 % in the topsoil and approximately 3 % below 1 m
in depth. The incremental increase with depth was rather linear. The comparison
with potassium values measured at the soil surface leads to the conclusion that the
gamma-ray signal integrated over larger depths (at least 0.5 m). On the other hand,
Acrisols with low activity clays showed lower average values and no depth trends at
all, but rather a fluctuation around an average value, which was also reflected in the
surface measurement (0.7 and 1.1 % K).
Texture differences alone are not able to explain the K signal with depth, since
they always showed a maximum clay concentration between 0.4 and 0.8 m down.
However, with the clay concentration converted into mass when multiplying it by
bulk density and assuming unity volume, and with the clay mineral quality
0.00
0.00
0.00
0.00
10.00
20.00
40.00
50.00
60.00
70.00
80.00
0
Index (clay*BD*CECclay)
K (%)
K (%)
K (%)
K (%)
Lower depth [cm]
Depth (cm)
Depth (cm)
Depth (cm)
Depth (cm)
–50
–100
–150
–200
0
1000
Acrisol
Granite/gneiss
K: I. I %
Acrisol (granite/gneiss)
Acrisol
Limestone
K: 0.7 %
Acrisol (limestone)
Alisol
Mudstone
K: 2.6 %
Alisol (mudstone)
Luvisol (siltstone)
Luvisol
Siltstone
K: 2.6 %
2000
3000
4000
5000
90.00
100.00
80.00
90.00
100.00
110.00
120.00
30.00
0.00
10.00
20.00
40.00
50.00
60.00
70.00
30.00
80.00
90.00
100.00
110.00
120.00
0.00
10.00
20.00
40.00
50.00
60.00
70.00
30.00
80.00
90.00
100.00
110.00
120.00
130.00
140.00
0.00
10.00
20.00
40.00
50.00
60.00
70.00
30.00
0.20 0.40 0.60 0.80 1.00
1.00
1.00
2.00
2.00 3.00 4.00
0.00 1.00
2.00 3.00 4.00
a
b
Fig. 2.2 (a) The potassium surface and soil profile gamma-ray signal of clay illuviation type soils
in Bor Krai village, northern Thailand. (b) The K gamma ray depth pattern can be explained by
combining the factors’ clay concentration and bulk density with the potential cation exchange
capacity of the clay fraction (LAC, HAC low and high activity clay respectively)
2 Beyond the Horizons: Challenges and Prospects for Soil Science and Soil. . .
43
above mentioned results, one can hypothesize that clay illuviation leads to a
maximum K gamma-ray signal in the Bt-horizon and that the K signal of soils
with low activity clays will be lower. Figure 2.2a shows that from our study, the
Reference Soil Groups for high activity clays (Alisol, Luvisol) showed a clear depth
gradient, with K values below 2 % in the topsoil and approximately 3 % below 1 m
in depth. The incremental increase with depth was rather linear. The comparison
with potassium values measured at the soil surface leads to the conclusion that the
gamma-ray signal integrated over larger depths (at least 0.5 m). On the other hand,
Acrisols with low activity clays showed lower average values and no depth trends at
all, but rather a fluctuation around an average value, which was also reflected in the
surface measurement (0.7 and 1.1 % K).
Texture differences alone are not able to explain the K signal with depth, since
they always showed a maximum clay concentration between 0.4 and 0.8 m down.
However, with the clay concentration converted into mass when multiplying it by
bulk density and assuming unity volume, and with the clay mineral quality
0.00
0.00
0.00
0.00
10.00
20.00
40.00
50.00
60.00
70.00
80.00
0
Index (clay*BD*CECclay)
K (%)
K (%)
K (%)
K (%)
Lower depth [cm]
Depth (cm)
Depth (cm)
Depth (cm)
Depth (cm)
–50
–100
–150
–200
0
1000
Acrisol
Granite/gneiss
K: I. I %
Acrisol (granite/gneiss)
Acrisol
Limestone
K: 0.7 %
Acrisol (limestone)
Alisol
Mudstone
K: 2.6 %
Alisol (mudstone)
Luvisol (siltstone)
Luvisol
Siltstone
K: 2.6 %
2000
3000
4000
5000
90.00
100.00
80.00
90.00
100.00
110.00
120.00
30.00
0.00
10.00
20.00
40.00
50.00
60.00
70.00
30.00
80.00
90.00
100.00
110.00
120.00
0.00
10.00
20.00
40.00
50.00
60.00
70.00
30.00
80.00
90.00
100.00
110.00
120.00
130.00
140.00
0.00
10.00
20.00
40.00
50.00
60.00
70.00
30.00
0.20 0.40 0.60 0.80 1.00
1.00
1.00
2.00
2.00 3.00 4.00
0.00 1.00
2.00 3.00 4.00
a
b
Fig. 2.2 (a) The potassium surface and soil profile gamma-ray signal of clay illuviation type soils
in Bor Krai village, northern Thailand. (b) The K gamma ray depth pattern can be explained by
combining the factors’ clay concentration and bulk density with the potential cation exchange
capacity of the clay fraction (LAC, HAC low and high activity clay respectively)
2 Beyond the Horizons: Challenges and Prospects for Soil Science and Soil. . .
43