

Thirdly, analyzing yields after 25 years showed that it was mainly maize that
was affected by soil conservation measures, as expected (Fig. 10.6 right). Due to
landscape-related factors, both maize-derived erosion rates and maize yields
showed large spatial variability, as shown in Table 10.2.
Clear differences in average maize yields appeared between fertilizer levels,
regardless of the soil conservation measures used. Yields under F0 dropped quickly
from about 3 Mg ha
À1 in the first year to about 0.3 Mg ha
À1 in the second and then
less than 0.1 Mg ha
À1 in the following years (data not shown). Under farmers’
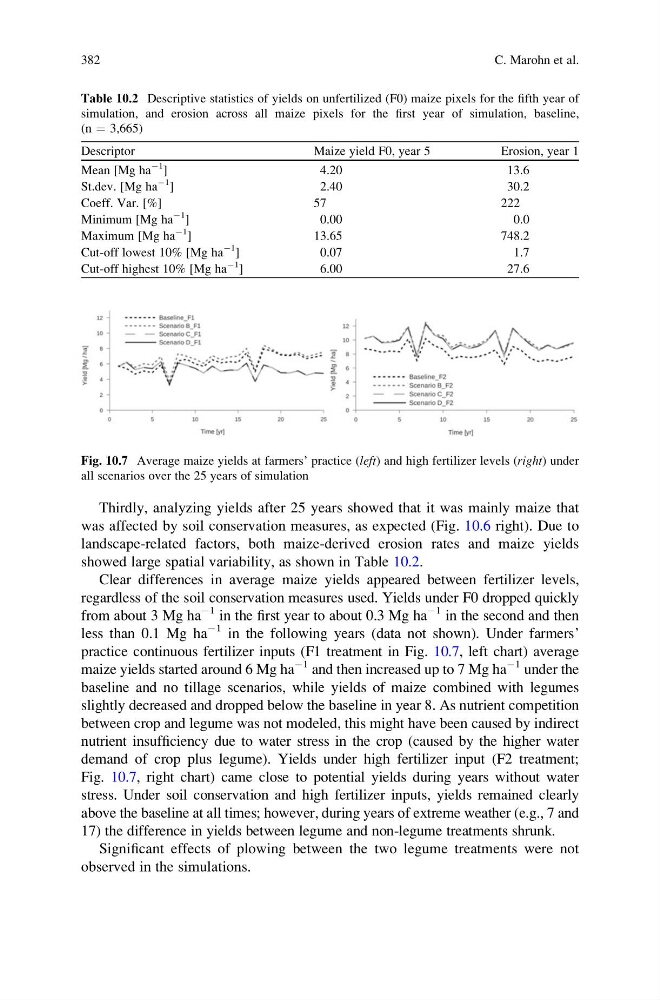
practice continuous fertilizer inputs (F1 treatment in Fig. 10.7, left chart) average
maize yields started around 6 Mg ha
À1 and then increased up to 7 Mg ha
À1 under the
baseline and no tillage scenarios, while yields of maize combined with legumes
slightly decreased and dropped below the baseline in year 8. As nutrient competition
between crop and legume was not modeled, this might have been caused by indirect
nutrient insufficiency due to water stress in the crop (caused by the higher water
demand of crop plus legume). Yields under high fertilizer input (F2 treatment;
Fig. 10.7, right chart) came close to potential yields during years without water
stress. Under soil conservation and high fertilizer inputs, yields remained clearly
above the baseline at all times; however, during years of extreme weather (e.g., 7 and
17) the difference in yields between legume and non-legume treatments shrunk.
Significant effects of plowing between the two legume treatments were not
observed in the simulations.
Table 10.2 Descriptive statistics of yields on unfertilized (F0) maize pixels for the fifth year of
simulation, and erosion across all maize pixels for the first year of simulation, baseline,
(n ¼ 3,665)
Descriptor
Maize yield F0, year 5
Erosion, year 1
Mean [Mg ha
À1
]
4.20
13.6
St.dev. [Mg ha
À1
]
2.40
30.2
Coeff. Var. [%]
57
222
Minimum [Mg ha
À1
]
0.00
0.0
Maximum [Mg ha
À1
]
13.65
748.2
Cut-off lowest 10% [Mg ha
À1
]
0.07
1.7
Cut-off highest 10% [Mg ha
À1
]
6.00
27.6
Fig. 10.7 Average maize yields at farmers’ practice (left) and high fertilizer levels (right) under
all scenarios over the 25 years of simulation
382
C. Marohn et al.
was affected by soil conservation measures, as expected (Fig. 10.6 right). Due to
landscape-related factors, both maize-derived erosion rates and maize yields
showed large spatial variability, as shown in Table 10.2.
Clear differences in average maize yields appeared between fertilizer levels,
regardless of the soil conservation measures used. Yields under F0 dropped quickly
from about 3 Mg ha
À1 in the first year to about 0.3 Mg ha
À1 in the second and then
less than 0.1 Mg ha
À1 in the following years (data not shown). Under farmers’
practice continuous fertilizer inputs (F1 treatment in Fig. 10.7, left chart) average
maize yields started around 6 Mg ha
À1 and then increased up to 7 Mg ha
À1 under the
baseline and no tillage scenarios, while yields of maize combined with legumes
slightly decreased and dropped below the baseline in year 8. As nutrient competition
between crop and legume was not modeled, this might have been caused by indirect
nutrient insufficiency due to water stress in the crop (caused by the higher water
demand of crop plus legume). Yields under high fertilizer input (F2 treatment;
Fig. 10.7, right chart) came close to potential yields during years without water
stress. Under soil conservation and high fertilizer inputs, yields remained clearly
above the baseline at all times; however, during years of extreme weather (e.g., 7 and
17) the difference in yields between legume and non-legume treatments shrunk.
Significant effects of plowing between the two legume treatments were not
observed in the simulations.
Table 10.2 Descriptive statistics of yields on unfertilized (F0) maize pixels for the fifth year of
simulation, and erosion across all maize pixels for the first year of simulation, baseline,
(n ¼ 3,665)
Descriptor
Maize yield F0, year 5
Erosion, year 1
Mean [Mg ha
À1
]
4.20
13.6
St.dev. [Mg ha
À1
]
2.40
30.2
Coeff. Var. [%]
57
222
Minimum [Mg ha
À1
]
0.00
0.0
Maximum [Mg ha
À1
]
13.65
748.2
Cut-off lowest 10% [Mg ha
À1
]
0.07
1.7
Cut-off highest 10% [Mg ha
À1
]
6.00
27.6
Fig. 10.7 Average maize yields at farmers’ practice (left) and high fertilizer levels (right) under
all scenarios over the 25 years of simulation
382
C. Marohn et al.