

once field capacity is exceeded and there is free pore space in the subsoil. The
percolation rate depends on the minimum of top- and subsoil hydraulic conductivity. Capillary rise is the movement from the subsoil into the topsoil, as driven by the
matric potential of the topsoil and groundwater depth. Bypass flow is water
potentially infiltrating in due time, but limited by available space in the topsoil,
which directly enters the subsoil through macropores and cracks. Transpiration is
water uptake from both horizons (depending on the rooting depth of the plant stand)
into vegetation based on plant demand and water stocks above the permanent
wilting point. Evaporation from the topsoil into the atmosphere is driven by
reference evapotranspiration. Lateral flows between pixels occur in both soil
horizons, their magnitudes determined by source and receiving pixels, the available
water above field capacity, the hydraulic conductivity of the emitting pixel and the
hydraulic conductivity and pore space of the recipient pixel. The partitioning
between (vertical) percolation and lateral flows is regulated by the slope. Lateral
flows in the soil, as well as surface run-off, are distributed in the landscape along the
local drain direction map, which is derived from the DEM via a slope map.
Soil erosion is simulated following a process-based approach (Rose et al. 2007)
as implemented in WaNuLCAS (van Noordwijk and Lusiana 1999). Soil on a
specific pixel is detached by rain or entrained by sediments travelling through the
pixel. Once the transport capacity of the run-off water is exceeded, particles in the
water flow are deposited. Sediment loads are transported downslope along the local
drain direction map. Erosion and deposition in the model dynamically alter topsoil
depth, affecting water holding capacity and nutrient storage in the soil profile.
10.2.3.3 Plants
Vegetation types in the landscape are read from land cover maps. At the pixel scale,
vegetation characteristics are calculated at the stand level, not accounting for
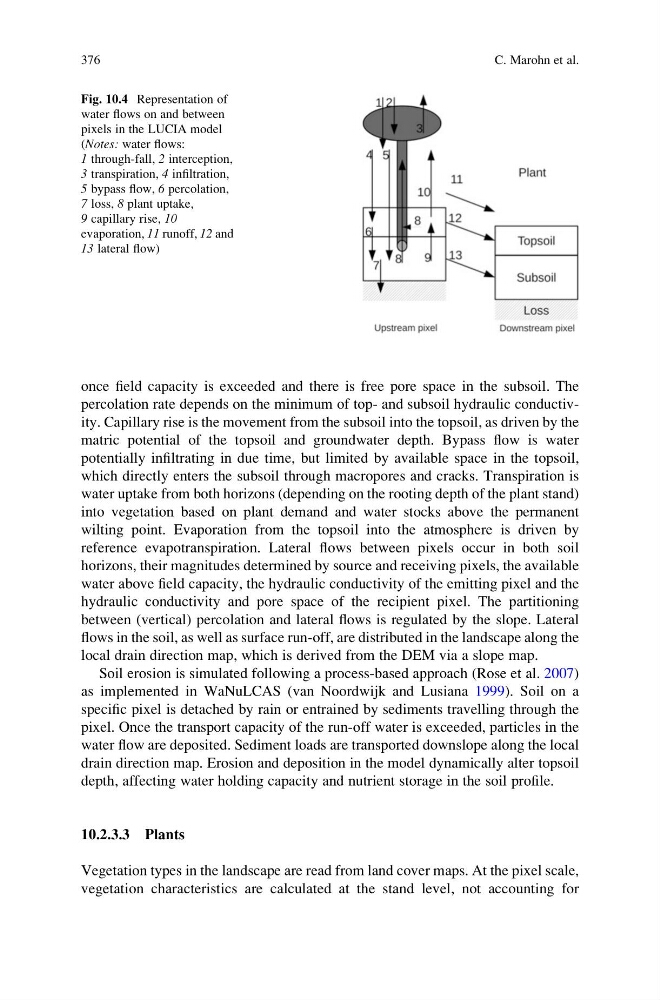
Fig. 10.4 Representation of
water flows on and between
pixels in the LUCIA model
(Notes: water flows:
1 through-fall, 2 interception,
3 transpiration, 4 infiltration,
5 bypass flow, 6 percolation,
7 loss, 8 plant uptake,
9 capillary rise, 10
evaporation, 11 runoff, 12 and
13 lateral flow)
376
C. Marohn et al.
percolation rate depends on the minimum of top- and subsoil hydraulic conductivity. Capillary rise is the movement from the subsoil into the topsoil, as driven by the
matric potential of the topsoil and groundwater depth. Bypass flow is water
potentially infiltrating in due time, but limited by available space in the topsoil,
which directly enters the subsoil through macropores and cracks. Transpiration is
water uptake from both horizons (depending on the rooting depth of the plant stand)
into vegetation based on plant demand and water stocks above the permanent
wilting point. Evaporation from the topsoil into the atmosphere is driven by
reference evapotranspiration. Lateral flows between pixels occur in both soil
horizons, their magnitudes determined by source and receiving pixels, the available
water above field capacity, the hydraulic conductivity of the emitting pixel and the
hydraulic conductivity and pore space of the recipient pixel. The partitioning
between (vertical) percolation and lateral flows is regulated by the slope. Lateral
flows in the soil, as well as surface run-off, are distributed in the landscape along the
local drain direction map, which is derived from the DEM via a slope map.
Soil erosion is simulated following a process-based approach (Rose et al. 2007)
as implemented in WaNuLCAS (van Noordwijk and Lusiana 1999). Soil on a
specific pixel is detached by rain or entrained by sediments travelling through the
pixel. Once the transport capacity of the run-off water is exceeded, particles in the
water flow are deposited. Sediment loads are transported downslope along the local
drain direction map. Erosion and deposition in the model dynamically alter topsoil
depth, affecting water holding capacity and nutrient storage in the soil profile.
10.2.3.3 Plants
Vegetation types in the landscape are read from land cover maps. At the pixel scale,
vegetation characteristics are calculated at the stand level, not accounting for
Fig. 10.4 Representation of
water flows on and between
pixels in the LUCIA model
(Notes: water flows:
1 through-fall, 2 interception,
3 transpiration, 4 infiltration,
5 bypass flow, 6 percolation,
7 loss, 8 plant uptake,
9 capillary rise, 10
evaporation, 11 runoff, 12 and
13 lateral flow)
376
C. Marohn et al.