

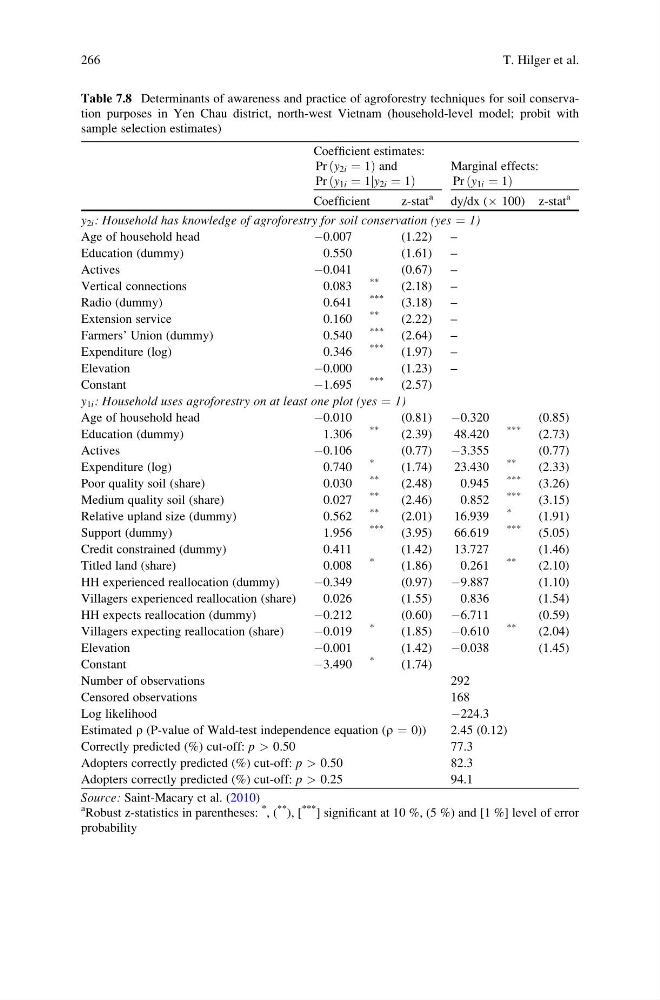
Table 7.8 Determinants of awareness and practice of agroforestry techniques for soil conservation purposes in Yen Chau district, north-west Vietnam (household-level model; probit with
sample selection estimates)
Coefficient estimates:
Pr ðy 2i ¼ 1Þ and
Pr y 1i ¼ 1jy 2i ¼ 1
ð
Þ
Marginal effects:
Pr ðy 1i ¼ 1Þ
Coefficient
z-stat
a
dy/dx (Â 100) z-stat
a
y 2i : Household has knowledge of agroforestry for soil conservation (yes ¼ 1)
Age of household head
À0.007
(1.22) –
Education (dummy)
0.550
(1.61) –
Actives
À0.041
(0.67) –
Vertical connections
0.083
**
(2.18) –
Radio (dummy)
0.641
***
(3.18) –
Extension service
0.160
**
(2.22) –
Farmers’ Union (dummy)
0.540
***
(2.64) –
Expenditure (log)
0.346
***
(1.97) –
Elevation
À0.000
(1.23) –
Constant
À1.695
***
(2.57)
y 1i : Household uses agroforestry on at least one plot (yes ¼ 1)
Age of household head
À0.010
(0.81) À0.320
(0.85)
Education (dummy)
1.306
**
(2.39)
48.420
***
(2.73)
Actives
À0.106
(0.77) À3.355
(0.77)
Expenditure (log)
0.740
*
(1.74)
23.430
**
(2.33)
Poor quality soil (share)
0.030
**
(2.48)
0.945
***
(3.26)
Medium quality soil (share)
0.027
**
(2.46)
0.852
***
(3.15)
Relative upland size (dummy)
0.562
**
(2.01)
16.939
*
(1.91)
Support (dummy)
1.956
***
(3.95)
66.619
***
(5.05)
Credit constrained (dummy)
0.411
(1.42)
13.727
(1.46)
Titled land (share)
0.008
*
(1.86)
0.261
**
(2.10)
HH experienced reallocation (dummy)
À0.349
(0.97) À9.887
(1.10)
Villagers experienced reallocation (share)
0.026
(1.55)
0.836
(1.54)
HH expects reallocation (dummy)
À0.212
(0.60) À6.711
(0.59)
Villagers expecting reallocation (share)
À0.019
*
(1.85) À0.610
**
(2.04)
Elevation
À0.001
(1.42) À0.038
(1.45)
Constant
À3.490
*
(1.74)
Number of observations
292
Censored observations
168
Log likelihood
À224.3
Estimated r (P-value of Wald-test independence equation (r ¼ 0))
2.45 (0.12)
Correctly predicted (%) cut-off: p > 0.50
77.3
Adopters correctly predicted (%) cut-off: p > 0.50
82.3
Adopters correctly predicted (%) cut-off: p > 0.25
94.1
Source: Saint-Macary et al. (2010)
a
Robust z-statistics in parentheses:
*
, (
**
), [
***
] significant at 10 %, (5 %) and [1 %] level of error
probability
266
T. Hilger et al.
sample selection estimates)
Coefficient estimates:
Pr ðy 2i ¼ 1Þ and
Pr y 1i ¼ 1jy 2i ¼ 1
ð
Þ
Marginal effects:
Pr ðy 1i ¼ 1Þ
Coefficient
z-stat
a
dy/dx (Â 100) z-stat
a
y 2i : Household has knowledge of agroforestry for soil conservation (yes ¼ 1)
Age of household head
À0.007
(1.22) –
Education (dummy)
0.550
(1.61) –
Actives
À0.041
(0.67) –
Vertical connections
0.083
**
(2.18) –
Radio (dummy)
0.641
***
(3.18) –
Extension service
0.160
**
(2.22) –
Farmers’ Union (dummy)
0.540
***
(2.64) –
Expenditure (log)
0.346
***
(1.97) –
Elevation
À0.000
(1.23) –
Constant
À1.695
***
(2.57)
y 1i : Household uses agroforestry on at least one plot (yes ¼ 1)
Age of household head
À0.010
(0.81) À0.320
(0.85)
Education (dummy)
1.306
**
(2.39)
48.420
***
(2.73)
Actives
À0.106
(0.77) À3.355
(0.77)
Expenditure (log)
0.740
*
(1.74)
23.430
**
(2.33)
Poor quality soil (share)
0.030
**
(2.48)
0.945
***
(3.26)
Medium quality soil (share)
0.027
**
(2.46)
0.852
***
(3.15)
Relative upland size (dummy)
0.562
**
(2.01)
16.939
*
(1.91)
Support (dummy)
1.956
***
(3.95)
66.619
***
(5.05)
Credit constrained (dummy)
0.411
(1.42)
13.727
(1.46)
Titled land (share)
0.008
*
(1.86)
0.261
**
(2.10)
HH experienced reallocation (dummy)
À0.349
(0.97) À9.887
(1.10)
Villagers experienced reallocation (share)
0.026
(1.55)
0.836
(1.54)
HH expects reallocation (dummy)
À0.212
(0.60) À6.711
(0.59)
Villagers expecting reallocation (share)
À0.019
*
(1.85) À0.610
**
(2.04)
Elevation
À0.001
(1.42) À0.038
(1.45)
Constant
À3.490
*
(1.74)
Number of observations
292
Censored observations
168
Log likelihood
À224.3
Estimated r (P-value of Wald-test independence equation (r ¼ 0))
2.45 (0.12)
Correctly predicted (%) cut-off: p > 0.50
77.3
Adopters correctly predicted (%) cut-off: p > 0.50
82.3
Adopters correctly predicted (%) cut-off: p > 0.25
94.1
Source: Saint-Macary et al. (2010)
a
Robust z-statistics in parentheses:
*
, (
**
), [
***
] significant at 10 %, (5 %) and [1 %] level of error
probability
266
T. Hilger et al.