

7.5.1.2 Stable Isotopes
The effectiveness of SCT when based on contour hedgerows can be reduced by the
competition for nutrients, light and water between crops in the alley and the species
that form the hedges (Dercon et al. 2006a). Identification of the magnitude of each of
these processes at the field level is not straightforward, in particular when these
elements interact with each other, as in the case of nitrogen and water, which are the
main drivers of competition between crops and hedges under contour hedgerow
systems (Dercon et al. 2006b). In order to obtain a better insight into the processes
driving competition between crops and hedgerows, the stable carbon isotope ratios
(d
13
C) of crops can help quantify crop–hedgerow competition levels; for example,
changes in d
13
C values in maize can be related to soil moisture and N availability
(Dercon et al. 2006b). Based on field data from Ban Bo Muang Noi in north-east
Thailand, Pansak et al. (2007) used a combination of stable isotope discrimination
and soil analysis methods to assess the impact of Leucaena leucocephala contour
hedgerow systems on the spatial variability of maize yields. For this purpose,
available NO 3
À –N was analyzed across the slope of the experimental plots, and
shoot N concentrations and d
13
C values in maize leaves were measured in the center
of the alleys and in the rows next to and on the upper side of the hedges. In order to
determine carbon isotope ratios in maize, the third youngest and fully developed leaf,
counted from the top of the plant, was collected 100 days after maize planting, dried
at 70
C and then ground with a ball mill, and the
13
C/
12
C ratio of the maize leaves
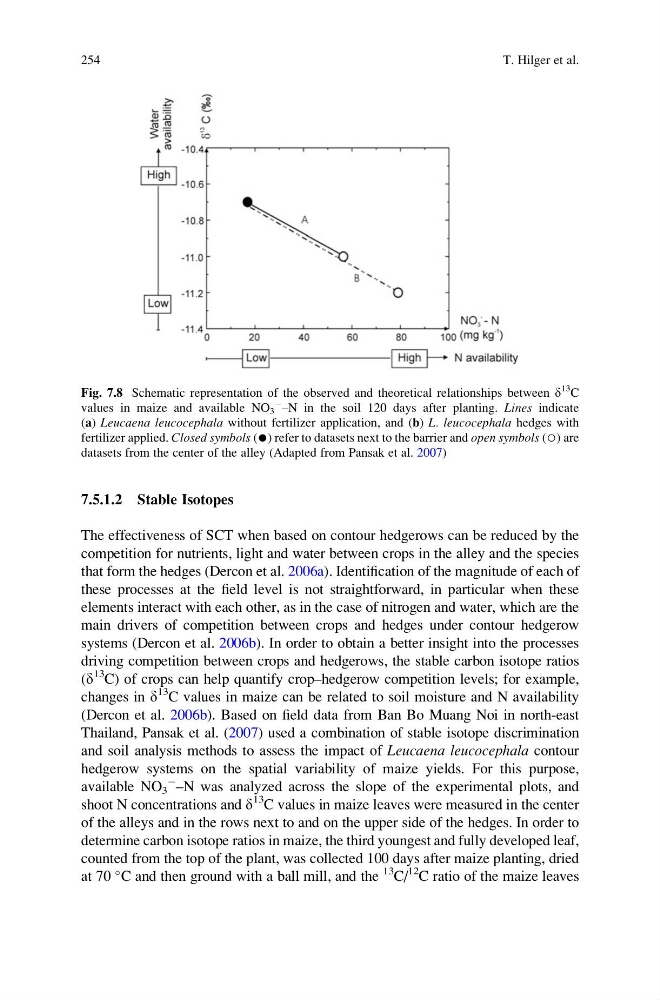
Fig. 7.8 Schematic representation of the observed and theoretical relationships between d
13
C
values in maize and available NO 3
À –N in the soil 120 days after planting. Lines indicate
(a) Leucaena leucocephala without fertilizer application, and (b) L. leucocephala hedges with
fertilizer applied. Closed symbols (●) refer to datasets next to the barrier and open symbols (○) are
datasets from the center of the alley (Adapted from Pansak et al. 2007)
254
T. Hilger et al.
The effectiveness of SCT when based on contour hedgerows can be reduced by the
competition for nutrients, light and water between crops in the alley and the species
that form the hedges (Dercon et al. 2006a). Identification of the magnitude of each of
these processes at the field level is not straightforward, in particular when these
elements interact with each other, as in the case of nitrogen and water, which are the
main drivers of competition between crops and hedges under contour hedgerow
systems (Dercon et al. 2006b). In order to obtain a better insight into the processes
driving competition between crops and hedgerows, the stable carbon isotope ratios
(d
13
C) of crops can help quantify crop–hedgerow competition levels; for example,
changes in d
13
C values in maize can be related to soil moisture and N availability
(Dercon et al. 2006b). Based on field data from Ban Bo Muang Noi in north-east
Thailand, Pansak et al. (2007) used a combination of stable isotope discrimination
and soil analysis methods to assess the impact of Leucaena leucocephala contour
hedgerow systems on the spatial variability of maize yields. For this purpose,
available NO 3
À –N was analyzed across the slope of the experimental plots, and
shoot N concentrations and d
13
C values in maize leaves were measured in the center
of the alleys and in the rows next to and on the upper side of the hedges. In order to
determine carbon isotope ratios in maize, the third youngest and fully developed leaf,
counted from the top of the plant, was collected 100 days after maize planting, dried
at 70
C and then ground with a ball mill, and the
13
C/
12
C ratio of the maize leaves
Fig. 7.8 Schematic representation of the observed and theoretical relationships between d
13
C
values in maize and available NO 3
À –N in the soil 120 days after planting. Lines indicate
(a) Leucaena leucocephala without fertilizer application, and (b) L. leucocephala hedges with
fertilizer applied. Closed symbols (●) refer to datasets next to the barrier and open symbols (○) are
datasets from the center of the alley (Adapted from Pansak et al. 2007)
254
T. Hilger et al.