

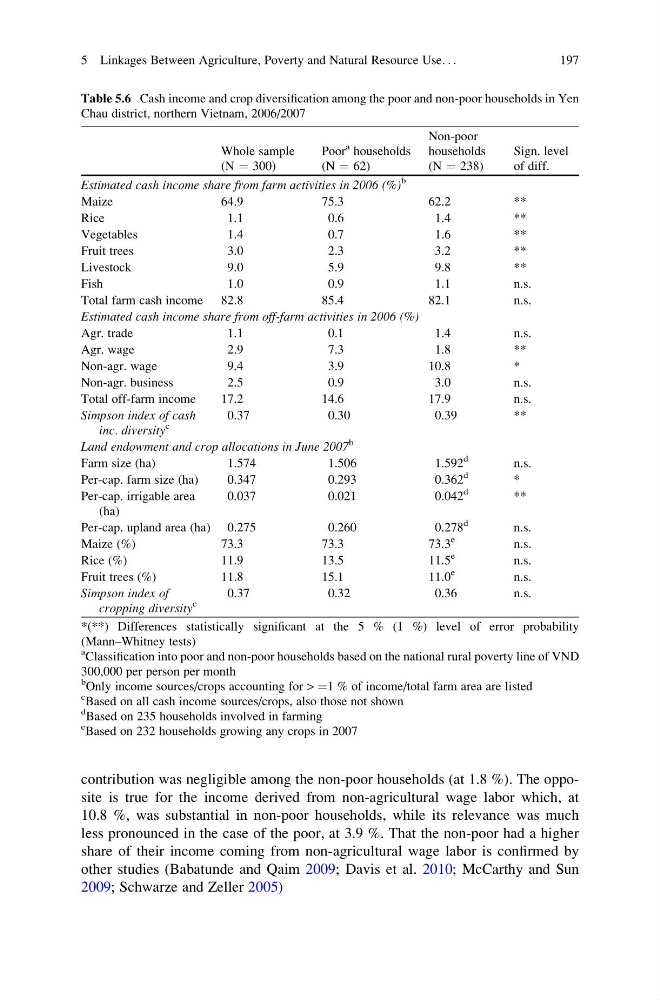
contribution was negligible among the non-poor households (at 1.8 %). The opposite is true for the income derived from non-agricultural wage labor which, at
10.8 %, was substantial in non-poor households, while its relevance was much
less pronounced in the case of the poor, at 3.9 %. That the non-poor had a higher
share of their income coming from non-agricultural wage labor is confirmed by
other studies (Babatunde and Qaim 2009; Davis et al. 2010; McCarthy and Sun
2009; Schwarze and Zeller 2005)
Table 5.6 Cash income and crop diversification among the poor and non-poor households in Yen
Chau district, northern Vietnam, 2006/2007
Whole sample
(N ¼ 300)
Poor
a households
(N ¼ 62)
Non-poor
households
(N ¼ 238)
Sign. level
of diff.
Estimated cash income share from farm activities in 2006 (%)
b
Maize
64.9
75.3
62.2
**
Rice
1.1
0.6
1.4
**
Vegetables
1.4
0.7
1.6
**
Fruit trees
3.0
2.3
3.2
**
Livestock
9.0
5.9
9.8
**
Fish
1.0
0.9
1.1
n.s.
Total farm cash income 82.8
85.4
82.1
n.s.
Estimated cash income share from off-farm activities in 2006 (%)
Agr. trade
1.1
0.1
1.4
n.s.
Agr. wage
2.9
7.3
1.8
**
Non-agr. wage
9.4
3.9
10.8
*
Non-agr. business
2.5
0.9
3.0
n.s.
Total off-farm income
17.2
14.6
17.9
n.s.
Simpson index of cash
inc. diversity
c
0.37
0.30
0.39
**
Land endowment and crop allocations in June 2007
b
Farm size (ha)
1.574
1.506
1.592
d
n.s.
Per-cap. farm size (ha)
0.347
0.293
0.362
d
*
Per-cap. irrigable area
(ha)
0.037
0.021
0.042
d
**
Per-cap. upland area (ha) 0.275
0.260
0.278
d
n.s.
Maize (%)
73.3
73.3
73.3
e
n.s.
Rice (%)
11.9
13.5
11.5
e
n.s.
Fruit trees (%)
11.8
15.1
11.0
e
n.s.
Simpson index of
cropping diversity
c
0.37
0.32
0.36
n.s.
*(**) Differences statistically significant at the 5 % (1 %) level of error probability
(Mann–Whitney tests)
a
Classification into poor and non-poor households based on the national rural poverty line of VND
300,000 per person per month
b
Only income sources/crops accounting for > ¼1 % of income/total farm area are listed
c
Based on all cash income sources/crops, also those not shown
d
Based on 235 households involved in farming
e
Based on 232 households growing any crops in 2007
5 Linkages Between Agriculture, Poverty and Natural Resource Use. . .
197
10.8 %, was substantial in non-poor households, while its relevance was much
less pronounced in the case of the poor, at 3.9 %. That the non-poor had a higher
share of their income coming from non-agricultural wage labor is confirmed by
other studies (Babatunde and Qaim 2009; Davis et al. 2010; McCarthy and Sun
2009; Schwarze and Zeller 2005)
Table 5.6 Cash income and crop diversification among the poor and non-poor households in Yen
Chau district, northern Vietnam, 2006/2007
Whole sample
(N ¼ 300)
Poor
a households
(N ¼ 62)
Non-poor
households
(N ¼ 238)
Sign. level
of diff.
Estimated cash income share from farm activities in 2006 (%)
b
Maize
64.9
75.3
62.2
**
Rice
1.1
0.6
1.4
**
Vegetables
1.4
0.7
1.6
**
Fruit trees
3.0
2.3
3.2
**
Livestock
9.0
5.9
9.8
**
Fish
1.0
0.9
1.1
n.s.
Total farm cash income 82.8
85.4
82.1
n.s.
Estimated cash income share from off-farm activities in 2006 (%)
Agr. trade
1.1
0.1
1.4
n.s.
Agr. wage
2.9
7.3
1.8
**
Non-agr. wage
9.4
3.9
10.8
*
Non-agr. business
2.5
0.9
3.0
n.s.
Total off-farm income
17.2
14.6
17.9
n.s.
Simpson index of cash
inc. diversity
c
0.37
0.30
0.39
**
Land endowment and crop allocations in June 2007
b
Farm size (ha)
1.574
1.506
1.592
d
n.s.
Per-cap. farm size (ha)
0.347
0.293
0.362
d
*
Per-cap. irrigable area
(ha)
0.037
0.021
0.042
d
**
Per-cap. upland area (ha) 0.275
0.260
0.278
d
n.s.
Maize (%)
73.3
73.3
73.3
e
n.s.
Rice (%)
11.9
13.5
11.5
e
n.s.
Fruit trees (%)
11.8
15.1
11.0
e
n.s.
Simpson index of
cropping diversity
c
0.37
0.32
0.36
n.s.
*(**) Differences statistically significant at the 5 % (1 %) level of error probability
(Mann–Whitney tests)
a
Classification into poor and non-poor households based on the national rural poverty line of VND
300,000 per person per month
b
Only income sources/crops accounting for > ¼1 % of income/total farm area are listed
c
Based on all cash income sources/crops, also those not shown
d
Based on 235 households involved in farming
e
Based on 232 households growing any crops in 2007
5 Linkages Between Agriculture, Poverty and Natural Resource Use. . .
197