

were negative and statistically significant when risk preferences were based on the
self-assessment scale only (p < 0.01). The correlation indicates that higher discount rates are associated with lower levels of risk aversion.
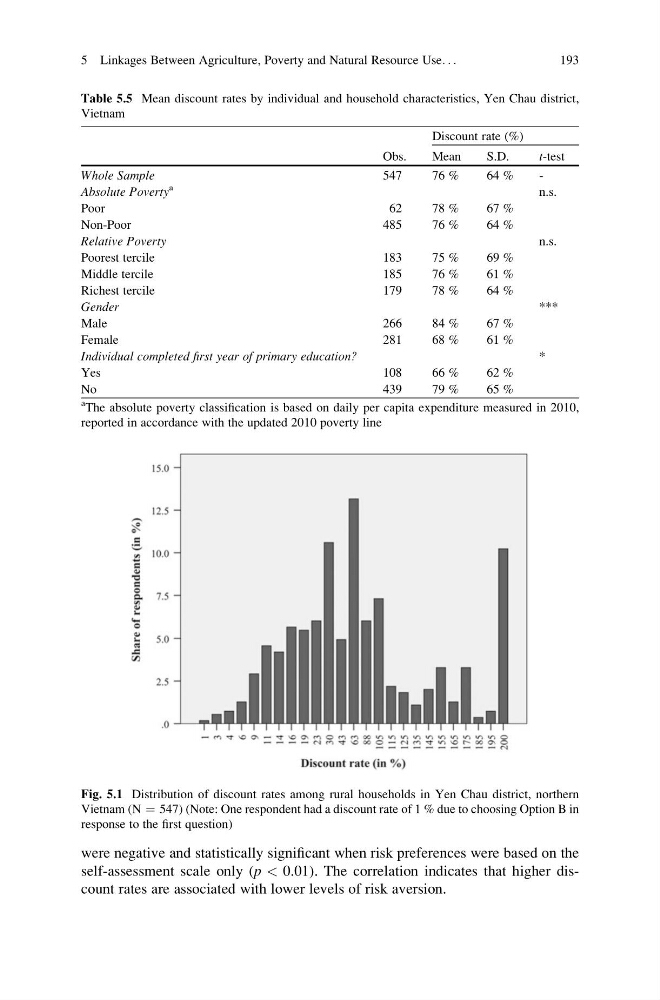
Fig. 5.1 Distribution of discount rates among rural households in Yen Chau district, northern
Vietnam (N ¼ 547) (Note: One respondent had a discount rate of 1 % due to choosing Option B in
response to the first question)
Table 5.5 Mean discount rates by individual and household characteristics, Yen Chau district,
Vietnam
Obs.
Discount rate (%)
Mean
S.D.
t-test
Whole Sample
547
76 %
64 %
-
Absolute Poverty
a
n.s.
Poor
62
78 %
67 %
Non-Poor
485
76 %
64 %
Relative Poverty
n.s.
Poorest tercile
183
75 %
69 %
Middle tercile
185
76 %
61 %
Richest tercile
179
78 %
64 %
Gender
***
Male
266
84 %
67 %
Female
281
68 %
61 %
Individual completed first year of primary education?
*
Yes
108
66 %
62 %
No
439
79 %
65 %
a
The absolute poverty classification is based on daily per capita expenditure measured in 2010,
reported in accordance with the updated 2010 poverty line
5 Linkages Between Agriculture, Poverty and Natural Resource Use. . .
193
self-assessment scale only (p < 0.01). The correlation indicates that higher discount rates are associated with lower levels of risk aversion.
Fig. 5.1 Distribution of discount rates among rural households in Yen Chau district, northern
Vietnam (N ¼ 547) (Note: One respondent had a discount rate of 1 % due to choosing Option B in
response to the first question)
Table 5.5 Mean discount rates by individual and household characteristics, Yen Chau district,
Vietnam
Obs.
Discount rate (%)
Mean
S.D.
t-test
Whole Sample
547
76 %
64 %
-
Absolute Poverty
a
n.s.
Poor
62
78 %
67 %
Non-Poor
485
76 %
64 %
Relative Poverty
n.s.
Poorest tercile
183
75 %
69 %
Middle tercile
185
76 %
61 %
Richest tercile
179
78 %
64 %
Gender
***
Male
266
84 %
67 %
Female
281
68 %
61 %
Individual completed first year of primary education?
*
Yes
108
66 %
62 %
No
439
79 %
65 %
a
The absolute poverty classification is based on daily per capita expenditure measured in 2010,
reported in accordance with the updated 2010 poverty line
5 Linkages Between Agriculture, Poverty and Natural Resource Use. . .
193