

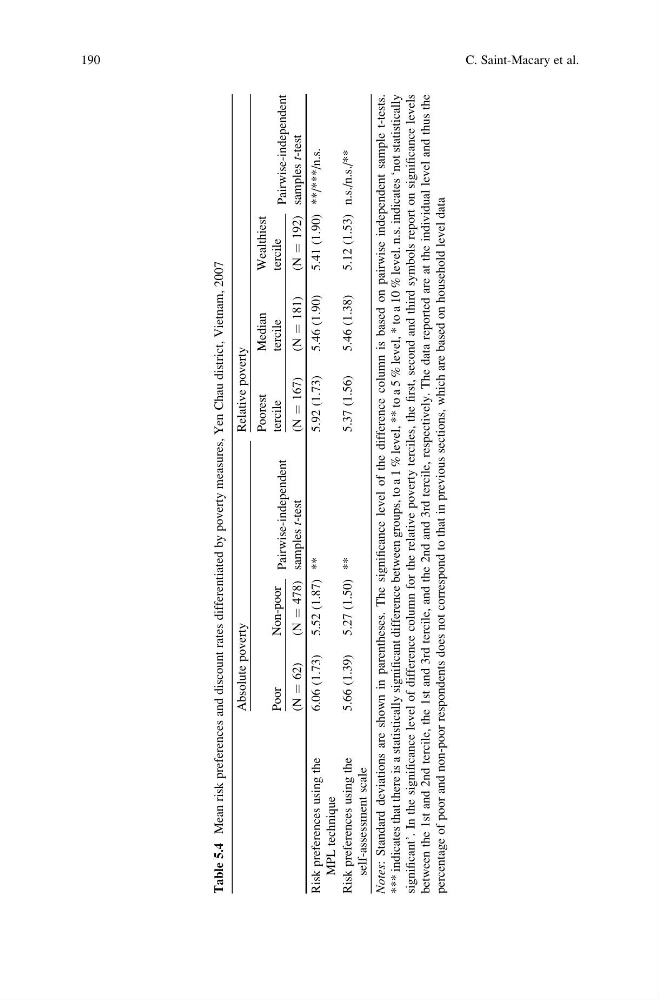
Table 5.4 Mean risk preferences and discount rates differentiated by poverty measures, Yen Chau district, Vietnam, 2007
Absolute poverty
Relative poverty
Poor
Non-poor
Pairwise-independent
samples
t-test
Poorest
tercile
Median
tercile
Wealthiest
tercile
Pairwise-independent
samples
t-test
(N
¼ 62)
(N
¼ 478)
(N
¼ 167)
(N
¼ 181)
(N
¼ 192)
Risk preferences using the
MPL technique
6.06 (1.73) 5.52 (1.87) **
5.92 (1.73)
5.46 (1.90)
5.41 (1.90) **/***/n.s.
Risk preferences using the
self-assessment scale
5.66 (1.39) 5.27 (1.50) **
5.37 (1.56)
5.46 (1.38)
5.12 (1.53) n.s./n.s./**
Notes: Standard deviations are shown in parentheses. The significance level of the difference column is based on pairwise independent sample t-tests.
*** indicates that there is a statistically significant difference between groups, to a 1 % level, ** to a 5 % level, * to a 10 % level. n.s. indicates ‘not statistically
significant’. In the significance level of difference column for the relative poverty terciles, the first, second and third symbols report on significance levels
between the 1st and 2nd tercile, the 1st and 3rd tercile, and the 2nd and 3rd tercile, respectively. The data reported are at the individual level and thus the
percentage of poor and non-poor respondents does not correspond to that in previous sections, which are based on household level data
190
C. Saint-Macary et al.
Absolute poverty
Relative poverty
Poor
Non-poor
Pairwise-independent
samples
t-test
Poorest
tercile
Median
tercile
Wealthiest
tercile
Pairwise-independent
samples
t-test
(N
¼ 62)
(N
¼ 478)
(N
¼ 167)
(N
¼ 181)
(N
¼ 192)
Risk preferences using the
MPL technique
6.06 (1.73) 5.52 (1.87) **
5.92 (1.73)
5.46 (1.90)
5.41 (1.90) **/***/n.s.
Risk preferences using the
self-assessment scale
5.66 (1.39) 5.27 (1.50) **
5.37 (1.56)
5.46 (1.38)
5.12 (1.53) n.s./n.s./**
Notes: Standard deviations are shown in parentheses. The significance level of the difference column is based on pairwise independent sample t-tests.
*** indicates that there is a statistically significant difference between groups, to a 1 % level, ** to a 5 % level, * to a 10 % level. n.s. indicates ‘not statistically
significant’. In the significance level of difference column for the relative poverty terciles, the first, second and third symbols report on significance levels
between the 1st and 2nd tercile, the 1st and 3rd tercile, and the 2nd and 3rd tercile, respectively. The data reported are at the individual level and thus the
percentage of poor and non-poor respondents does not correspond to that in previous sections, which are based on household level data
190
C. Saint-Macary et al.