

5.3.4.2 Risk Preferences
8
The presence of risks and the ways in which farmers perceive them have strong
implications for decision-making, notably in terms of decisions that affect shortand long-term natural resource use. There is no consensus on how risk preferences
differ based on respondent characteristics. While some studies have found, for
example, that risk preferences differ significantly based on gender (e.g., Gilliam
et al. 2010), education (e.g., Harrison et al. 2007), age (e.g., Tanaka et al. 2010) and
income (e.g., Cohen and Einav 2007), others have found no significant relationship,
e.g., Harrison et al. (2007) for gender, Anderson and Mellor (2009) for education,
Holt and Laury (2002) for age and Tanaka et al. (2010) for income.
In November and December of 2011, a questionnaire on risk preferences was
administered to 547 respondents (household heads and their spouses, if applicable)
across 289 households in Yen Chau district (see the beginning of Sect. 5.3.1 above
for an explanation of the sampling procedure), and here we examine risk
preferences among these households based on two elicitation methods: the multiple
price list (MPL) – an experimental method involving a lottery game with actual
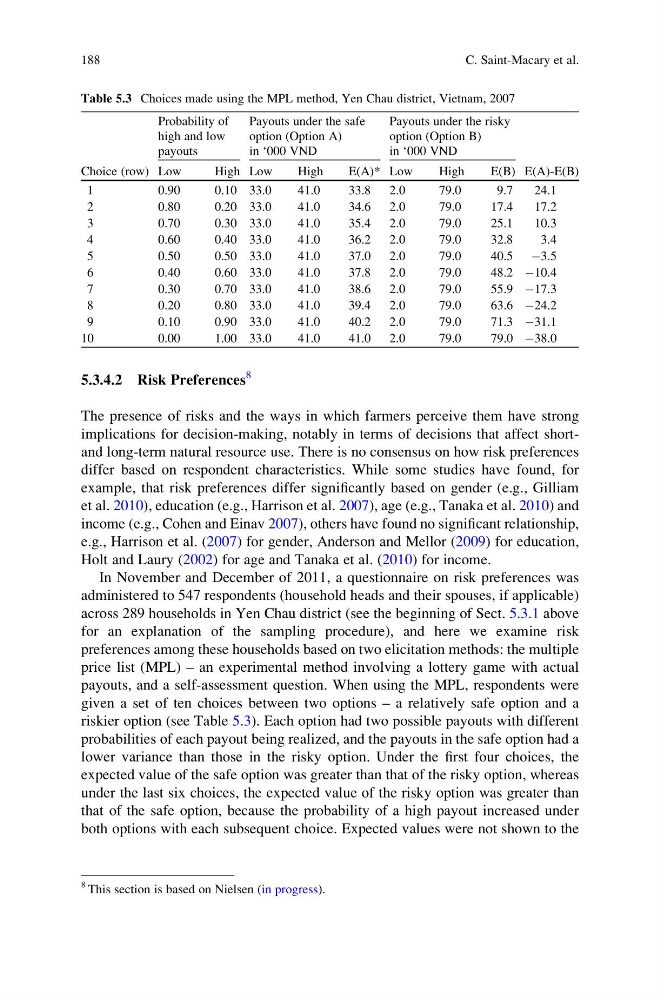
payouts, and a self-assessment question. When using the MPL, respondents were
given a set of ten choices between two options – a relatively safe option and a
riskier option (see Table 5.3). Each option had two possible payouts with different
probabilities of each payout being realized, and the payouts in the safe option had a
lower variance than those in the risky option. Under the first four choices, the
expected value of the safe option was greater than that of the risky option, whereas
under the last six choices, the expected value of the risky option was greater than
that of the safe option, because the probability of a high payout increased under
both options with each subsequent choice. Expected values were not shown to the
Table 5.3 Choices made using the MPL method, Yen Chau district, Vietnam, 2007
Choice (row)
Probability of
high and low
payouts
Payouts under the safe
option (Option A)
in ‘000 VND
Payouts under the risky
option (Option B)
in ‘000 VND
E(A)-E(B)
Low
High Low
High
E(A)* Low
High
E(B)
1
0.90
0.10 33.0
41.0
33.8 2.0
79.0
9.7
24.1
2
0.80
0.20 33.0
41.0
34.6 2.0
79.0
17.4
17.2
3
0.70
0.30 33.0
41.0
35.4 2.0
79.0
25.1
10.3
4
0.60
0.40 33.0
41.0
36.2 2.0
79.0
32.8
3.4
5
0.50
0.50 33.0
41.0
37.0 2.0
79.0
40.5 À3.5
6
0.40
0.60 33.0
41.0
37.8 2.0
79.0
48.2 À10.4
7
0.30
0.70 33.0
41.0
38.6 2.0
79.0
55.9 À17.3
8
0.20
0.80 33.0
41.0
39.4 2.0
79.0
63.6 À24.2
9
0.10
0.90 33.0
41.0
40.2 2.0
79.0
71.3 À31.1
10
0.00
1.00 33.0
41.0
41.0 2.0
79.0
79.0 À38.0
8 This section is based on Nielsen (in progress).
188
C. Saint-Macary et al.
8
The presence of risks and the ways in which farmers perceive them have strong
implications for decision-making, notably in terms of decisions that affect shortand long-term natural resource use. There is no consensus on how risk preferences
differ based on respondent characteristics. While some studies have found, for
example, that risk preferences differ significantly based on gender (e.g., Gilliam
et al. 2010), education (e.g., Harrison et al. 2007), age (e.g., Tanaka et al. 2010) and
income (e.g., Cohen and Einav 2007), others have found no significant relationship,
e.g., Harrison et al. (2007) for gender, Anderson and Mellor (2009) for education,
Holt and Laury (2002) for age and Tanaka et al. (2010) for income.
In November and December of 2011, a questionnaire on risk preferences was
administered to 547 respondents (household heads and their spouses, if applicable)
across 289 households in Yen Chau district (see the beginning of Sect. 5.3.1 above
for an explanation of the sampling procedure), and here we examine risk
preferences among these households based on two elicitation methods: the multiple
price list (MPL) – an experimental method involving a lottery game with actual
payouts, and a self-assessment question. When using the MPL, respondents were
given a set of ten choices between two options – a relatively safe option and a
riskier option (see Table 5.3). Each option had two possible payouts with different
probabilities of each payout being realized, and the payouts in the safe option had a
lower variance than those in the risky option. Under the first four choices, the
expected value of the safe option was greater than that of the risky option, whereas
under the last six choices, the expected value of the risky option was greater than
that of the safe option, because the probability of a high payout increased under
both options with each subsequent choice. Expected values were not shown to the
Table 5.3 Choices made using the MPL method, Yen Chau district, Vietnam, 2007
Choice (row)
Probability of
high and low
payouts
Payouts under the safe
option (Option A)
in ‘000 VND
Payouts under the risky
option (Option B)
in ‘000 VND
E(A)-E(B)
Low
High Low
High
E(A)* Low
High
E(B)
1
0.90
0.10 33.0
41.0
33.8 2.0
79.0
9.7
24.1
2
0.80
0.20 33.0
41.0
34.6 2.0
79.0
17.4
17.2
3
0.70
0.30 33.0
41.0
35.4 2.0
79.0
25.1
10.3
4
0.60
0.40 33.0
41.0
36.2 2.0
79.0
32.8
3.4
5
0.50
0.50 33.0
41.0
37.0 2.0
79.0
40.5 À3.5
6
0.40
0.60 33.0
41.0
37.8 2.0
79.0
48.2 À10.4
7
0.30
0.70 33.0
41.0
38.6 2.0
79.0
55.9 À17.3
8
0.20
0.80 33.0
41.0
39.4 2.0
79.0
63.6 À24.2
9
0.10
0.90 33.0
41.0
40.2 2.0
79.0
71.3 À31.1
10
0.00
1.00 33.0
41.0
41.0 2.0
79.0
79.0 À38.0
8 This section is based on Nielsen (in progress).
188
C. Saint-Macary et al.