

Two randomly selected nested sampling plots of 100 m
2 per perennial LUT were
selected to assess the ABG biomass parameters for trees, mid-, and understorey
vegetation, plus coarse litter (Fig. 3.15). For all trees, >5 cm diameter at breast
height (DBH), height and DBH were measured. The fresh-weights of mid- and
understorey vegetation, as well as coarse litter, were determined destructively in
2 Â 25 m
2 , 4 Â 1 m
2 and 8 Â 0.25 m
2 sub-plots per plot respectively. Subsamples
were used for fresh-dry weight conversion. Samples were oven-dried at 70
C until
a constant weight was reached. For shrubs and bamboo, species-specific and
allometric equations were built from measurements taken at different growth stages
for height, canopy diameter, fresh and dry weight of the leaves, branches, stems and
roots (Zemek 2009).
To compare the different LUTs, the obtained data were time-averaged according
to the Alternatives to Slash-and-Burn Program (ASB 1999) protocol. At stand ages of
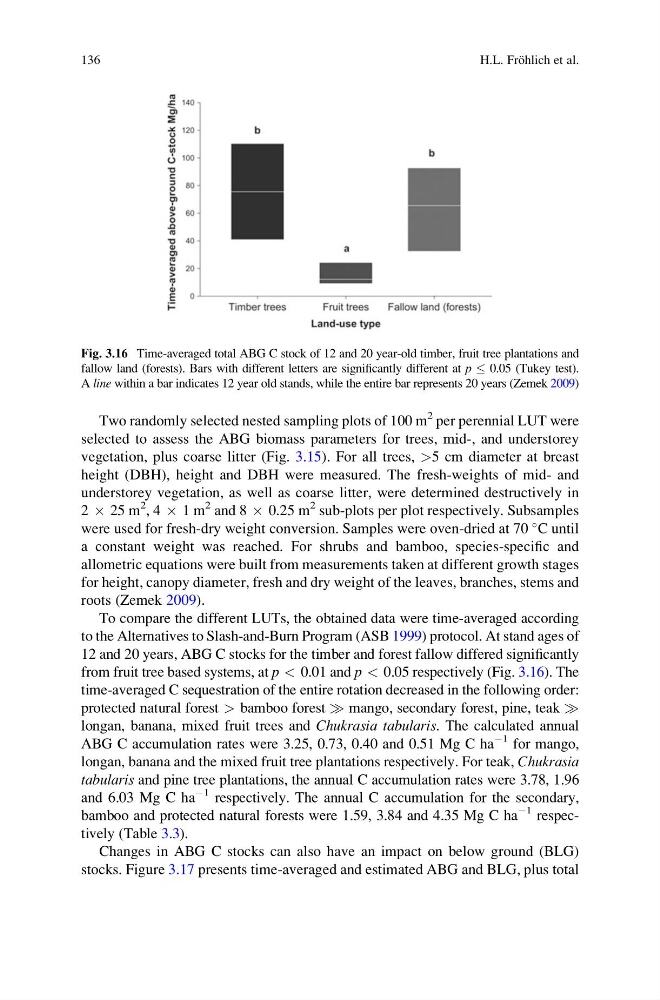
12 and 20 years, ABG C stocks for the timber and forest fallow differed significantly
from fruit tree based systems, at p < 0.01 and p < 0.05 respectively (Fig. 3.16). The
time-averaged C sequestration of the entire rotation decreased in the following order:
protected natural forest > bamboo forest ) mango, secondary forest, pine, teak )
longan, banana, mixed fruit trees and Chukrasia tabularis. The calculated annual
ABG C accumulation rates were 3.25, 0.73, 0.40 and 0.51 Mg C ha
À1 for mango,
longan, banana and the mixed fruit tree plantations respectively. For teak, Chukrasia
tabularis and pine tree plantations, the annual C accumulation rates were 3.78, 1.96
and 6.03 Mg C ha
À1 respectively. The annual C accumulation for the secondary,
bamboo and protected natural forests were 1.59, 3.84 and 4.35 Mg C ha
À1 respectively (Table 3.3).
Changes in ABG C stocks can also have an impact on below ground (BLG)
stocks. Figure 3.17 presents time-averaged and estimated ABG and BLG, plus total
Fig. 3.16 Time-averaged total ABG C stock of 12 and 20 year-old timber, fruit tree plantations and
fallow land (forests). Bars with different letters are significantly different at p 0.05 (Tukey test).
A line within a bar indicates 12 year old stands, while the entire bar represents 20 years (Zemek 2009)
136
H.L. Fro ¨hlich et al.
2 per perennial LUT were
selected to assess the ABG biomass parameters for trees, mid-, and understorey
vegetation, plus coarse litter (Fig. 3.15). For all trees, >5 cm diameter at breast
height (DBH), height and DBH were measured. The fresh-weights of mid- and
understorey vegetation, as well as coarse litter, were determined destructively in
2 Â 25 m
2 , 4 Â 1 m
2 and 8 Â 0.25 m
2 sub-plots per plot respectively. Subsamples
were used for fresh-dry weight conversion. Samples were oven-dried at 70
C until
a constant weight was reached. For shrubs and bamboo, species-specific and
allometric equations were built from measurements taken at different growth stages
for height, canopy diameter, fresh and dry weight of the leaves, branches, stems and
roots (Zemek 2009).
To compare the different LUTs, the obtained data were time-averaged according
to the Alternatives to Slash-and-Burn Program (ASB 1999) protocol. At stand ages of
12 and 20 years, ABG C stocks for the timber and forest fallow differed significantly
from fruit tree based systems, at p < 0.01 and p < 0.05 respectively (Fig. 3.16). The
time-averaged C sequestration of the entire rotation decreased in the following order:
protected natural forest > bamboo forest ) mango, secondary forest, pine, teak )
longan, banana, mixed fruit trees and Chukrasia tabularis. The calculated annual
ABG C accumulation rates were 3.25, 0.73, 0.40 and 0.51 Mg C ha
À1 for mango,
longan, banana and the mixed fruit tree plantations respectively. For teak, Chukrasia
tabularis and pine tree plantations, the annual C accumulation rates were 3.78, 1.96
and 6.03 Mg C ha
À1 respectively. The annual C accumulation for the secondary,
bamboo and protected natural forests were 1.59, 3.84 and 4.35 Mg C ha
À1 respectively (Table 3.3).
Changes in ABG C stocks can also have an impact on below ground (BLG)
stocks. Figure 3.17 presents time-averaged and estimated ABG and BLG, plus total
Fig. 3.16 Time-averaged total ABG C stock of 12 and 20 year-old timber, fruit tree plantations and
fallow land (forests). Bars with different letters are significantly different at p 0.05 (Tukey test).
A line within a bar indicates 12 year old stands, while the entire bar represents 20 years (Zemek 2009)
136
H.L. Fro ¨hlich et al.