

the water drains out of the bucket. Raising or lowering the opening of the valve
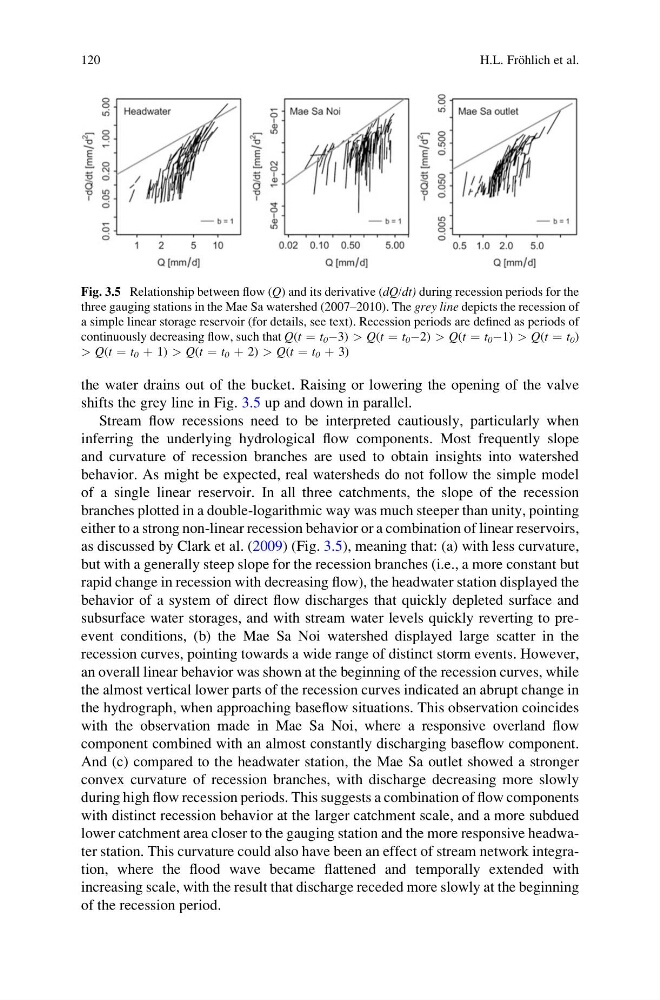
shifts the grey line in Fig. 3.5 up and down in parallel.
Stream flow recessions need to be interpreted cautiously, particularly when
inferring the underlying hydrological flow components. Most frequently slope
and curvature of recession branches are used to obtain insights into watershed
behavior. As might be expected, real watersheds do not follow the simple model
of a single linear reservoir. In all three catchments, the slope of the recession
branches plotted in a double-logarithmic way was much steeper than unity, pointing
either to a strong non-linear recession behavior or a combination of linear reservoirs,
as discussed by Clark et al. (2009) (Fig. 3.5), meaning that: (a) with less curvature,
but with a generally steep slope for the recession branches (i.e., a more constant but
rapid change in recession with decreasing flow), the headwater station displayed the
behavior of a system of direct flow discharges that quickly depleted surface and
subsurface water storages, and with stream water levels quickly reverting to preevent conditions, (b) the Mae Sa Noi watershed displayed large scatter in the
recession curves, pointing towards a wide range of distinct storm events. However,
an overall linear behavior was shown at the beginning of the recession curves, while
the almost vertical lower parts of the recession curves indicated an abrupt change in
the hydrograph, when approaching baseflow situations. This observation coincides
with the observation made in Mae Sa Noi, where a responsive overland flow
component combined with an almost constantly discharging baseflow component.
And (c) compared to the headwater station, the Mae Sa outlet showed a stronger
convex curvature of recession branches, with discharge decreasing more slowly
during high flow recession periods. This suggests a combination of flow components
with distinct recession behavior at the larger catchment scale, and a more subdued
lower catchment area closer to the gauging station and the more responsive headwater station. This curvature could also have been an effect of stream network integration, where the flood wave became flattened and temporally extended with
increasing scale, with the result that discharge receded more slowly at the beginning
of the recession period.
Fig. 3.5 Relationship between flow (Q) and its derivative (dQ/dt) during recession periods for the
three gauging stations in the Mae Sa watershed (2007–2010). The grey line depicts the recession of
a simple linear storage reservoir (for details, see text). Recession periods are defined as periods of
continuously decreasing flow, such that Q(t ¼ t 0 À3) > Q(t ¼ t 0 À2) > Q(t ¼ t 0 À1) > Q(t ¼ t 0 )
> Q(t ¼ t 0 þ 1) > Q(t ¼ t 0 þ 2) > Q(t ¼ t 0 þ 3)
120
H.L. Fro ¨hlich et al.
shifts the grey line in Fig. 3.5 up and down in parallel.
Stream flow recessions need to be interpreted cautiously, particularly when
inferring the underlying hydrological flow components. Most frequently slope
and curvature of recession branches are used to obtain insights into watershed
behavior. As might be expected, real watersheds do not follow the simple model
of a single linear reservoir. In all three catchments, the slope of the recession
branches plotted in a double-logarithmic way was much steeper than unity, pointing
either to a strong non-linear recession behavior or a combination of linear reservoirs,
as discussed by Clark et al. (2009) (Fig. 3.5), meaning that: (a) with less curvature,
but with a generally steep slope for the recession branches (i.e., a more constant but
rapid change in recession with decreasing flow), the headwater station displayed the
behavior of a system of direct flow discharges that quickly depleted surface and
subsurface water storages, and with stream water levels quickly reverting to preevent conditions, (b) the Mae Sa Noi watershed displayed large scatter in the
recession curves, pointing towards a wide range of distinct storm events. However,
an overall linear behavior was shown at the beginning of the recession curves, while
the almost vertical lower parts of the recession curves indicated an abrupt change in
the hydrograph, when approaching baseflow situations. This observation coincides
with the observation made in Mae Sa Noi, where a responsive overland flow
component combined with an almost constantly discharging baseflow component.
And (c) compared to the headwater station, the Mae Sa outlet showed a stronger
convex curvature of recession branches, with discharge decreasing more slowly
during high flow recession periods. This suggests a combination of flow components
with distinct recession behavior at the larger catchment scale, and a more subdued
lower catchment area closer to the gauging station and the more responsive headwater station. This curvature could also have been an effect of stream network integration, where the flood wave became flattened and temporally extended with
increasing scale, with the result that discharge receded more slowly at the beginning
of the recession period.
Fig. 3.5 Relationship between flow (Q) and its derivative (dQ/dt) during recession periods for the
three gauging stations in the Mae Sa watershed (2007–2010). The grey line depicts the recession of
a simple linear storage reservoir (for details, see text). Recession periods are defined as periods of
continuously decreasing flow, such that Q(t ¼ t 0 À3) > Q(t ¼ t 0 À2) > Q(t ¼ t 0 À1) > Q(t ¼ t 0 )
> Q(t ¼ t 0 þ 1) > Q(t ¼ t 0 þ 2) > Q(t ¼ t 0 þ 3)
120
H.L. Fro ¨hlich et al.