

2.5 Particle Velocimetry Measurements
77
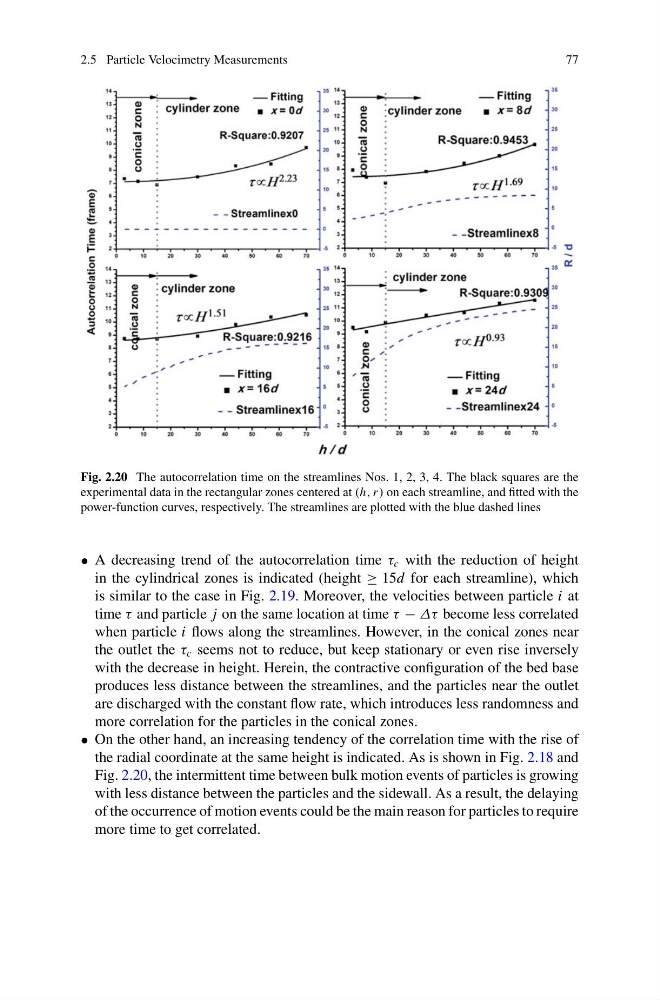
Fig. 2.20 The autocorrelation time on the streamlines Nos. 1, 2, 3, 4. The black squares are the
experimental data in the rectangular zones centered at (h, r ) on each streamline, and fitted with the
power-function curves, respectively. The streamlines are plotted with the blue dashed lines
• A decreasing trend of the autocorrelation time τ c with the reduction of height
in the cylindrical zones is indicated (height ≥ 15d for each streamline), which
is similar to the case in Fig. 2.19. Moreover, the velocities between particle i at
time τ and particle j on the same location at time τ − Δτ become less correlated
when particle i flows along the streamlines. However, in the conical zones near
the outlet the τ c seems not to reduce, but keep stationary or even rise inversely
with the decrease in height. Herein, the contractive configuration of the bed base
produces less distance between the streamlines, and the particles near the outlet
are discharged with the constant flow rate, which introduces less randomness and
more correlation for the particles in the conical zones.
• On the other hand, an increasing tendency of the correlation time with the rise of
the radial coordinate at the same height is indicated. As is shown in Fig. 2.18 and
Fig. 2.20, the intermittent time between bulk motion events of particles is growing
with less distance between the particles and the sidewall. As a result, the delaying
of the occurrence of motion events could be the main reason for particles to require
more time to get correlated.
77
Fig. 2.20 The autocorrelation time on the streamlines Nos. 1, 2, 3, 4. The black squares are the
experimental data in the rectangular zones centered at (h, r ) on each streamline, and fitted with the
power-function curves, respectively. The streamlines are plotted with the blue dashed lines
• A decreasing trend of the autocorrelation time τ c with the reduction of height
in the cylindrical zones is indicated (height ≥ 15d for each streamline), which
is similar to the case in Fig. 2.19. Moreover, the velocities between particle i at
time τ and particle j on the same location at time τ − Δτ become less correlated
when particle i flows along the streamlines. However, in the conical zones near
the outlet the τ c seems not to reduce, but keep stationary or even rise inversely
with the decrease in height. Herein, the contractive configuration of the bed base
produces less distance between the streamlines, and the particles near the outlet
are discharged with the constant flow rate, which introduces less randomness and
more correlation for the particles in the conical zones.
• On the other hand, an increasing tendency of the correlation time with the rise of
the radial coordinate at the same height is indicated. As is shown in Fig. 2.18 and
Fig. 2.20, the intermittent time between bulk motion events of particles is growing
with less distance between the particles and the sidewall. As a result, the delaying
of the occurrence of motion events could be the main reason for particles to require
more time to get correlated.