

74
2 Experiments in Pebble Flows
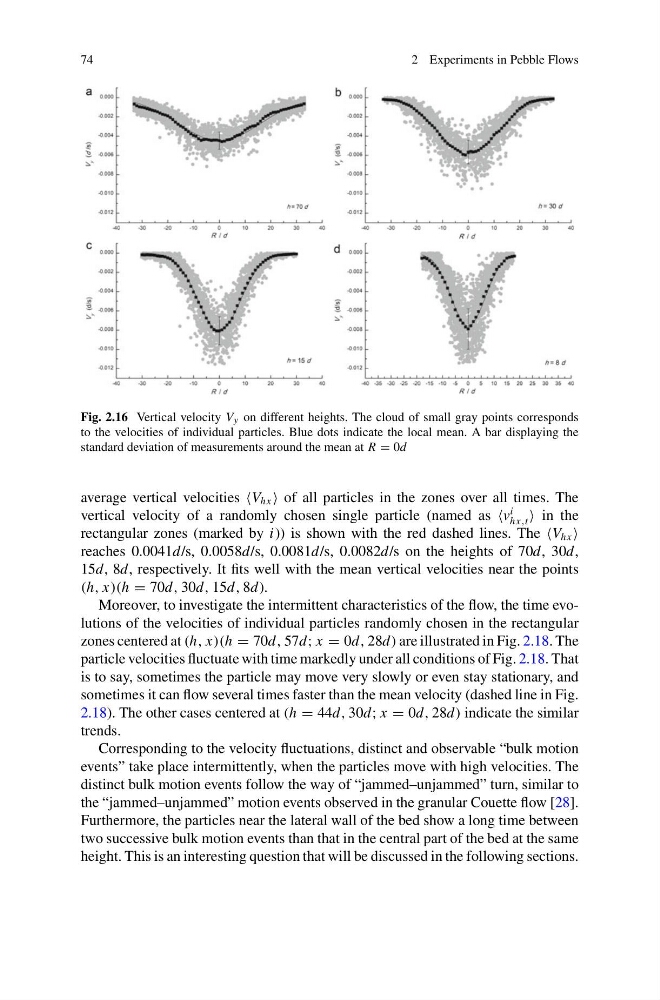
Fig. 2.16 Vertical velocity V y on different heights. The cloud of small gray points corresponds
to the velocities of individual particles. Blue dots indicate the local mean. A bar displaying the
standard deviation of measurements around the mean at R = 0d
average vertical velocities V hx of all particles in the zones over all times. The
vertical velocity of a randomly chosen single particle (named as v
i
hx,t in the
rectangular zones (marked by i)) is shown with the red dashed lines. The V hx
reaches 0.0041d/s, 0.0058d/s, 0.0081d/s, 0.0082d/s on the heights of 70d, 30d,
15d, 8d, respectively. It fits well with the mean vertical velocities near the points
(h, x)(h = 70d, 30d, 15d, 8d).
Moreover, to investigate the intermittent characteristics of the flow, the time evolutions of the velocities of individual particles randomly chosen in the rectangular
zones centered at (h, x)(h = 70d, 57d; x = 0d, 28d) are illustrated in Fig. 2.18. The
particle velocities fluctuate with time markedly under all conditions of Fig. 2.18. That
is to say, sometimes the particle may move very slowly or even stay stationary, and
sometimes it can flow several times faster than the mean velocity (dashed line in Fig.
2.18). The other cases centered at (h = 44d, 30d; x = 0d, 28d) indicate the similar
trends.
Corresponding to the velocity fluctuations, distinct and observable “bulk motion
events” take place intermittently, when the particles move with high velocities. The
distinct bulk motion events follow the way of “jammed–unjammed” turn, similar to
the “jammed–unjammed” motion events observed in the granular Couette flow [28].
Furthermore, the particles near the lateral wall of the bed show a long time between
two successive bulk motion events than that in the central part of the bed at the same
height. This is an interesting question that will be discussed in the following sections.
2 Experiments in Pebble Flows
Fig. 2.16 Vertical velocity V y on different heights. The cloud of small gray points corresponds
to the velocities of individual particles. Blue dots indicate the local mean. A bar displaying the
standard deviation of measurements around the mean at R = 0d
average vertical velocities V hx of all particles in the zones over all times. The
vertical velocity of a randomly chosen single particle (named as v
i
hx,t in the
rectangular zones (marked by i)) is shown with the red dashed lines. The V hx
reaches 0.0041d/s, 0.0058d/s, 0.0081d/s, 0.0082d/s on the heights of 70d, 30d,
15d, 8d, respectively. It fits well with the mean vertical velocities near the points
(h, x)(h = 70d, 30d, 15d, 8d).
Moreover, to investigate the intermittent characteristics of the flow, the time evolutions of the velocities of individual particles randomly chosen in the rectangular
zones centered at (h, x)(h = 70d, 57d; x = 0d, 28d) are illustrated in Fig. 2.18. The
particle velocities fluctuate with time markedly under all conditions of Fig. 2.18. That
is to say, sometimes the particle may move very slowly or even stay stationary, and
sometimes it can flow several times faster than the mean velocity (dashed line in Fig.
2.18). The other cases centered at (h = 44d, 30d; x = 0d, 28d) indicate the similar
trends.
Corresponding to the velocity fluctuations, distinct and observable “bulk motion
events” take place intermittently, when the particles move with high velocities. The
distinct bulk motion events follow the way of “jammed–unjammed” turn, similar to
the “jammed–unjammed” motion events observed in the granular Couette flow [28].
Furthermore, the particles near the lateral wall of the bed show a long time between
two successive bulk motion events than that in the central part of the bed at the same
height. This is an interesting question that will be discussed in the following sections.