

486
7 Applications: Pebble Flow Optimizations
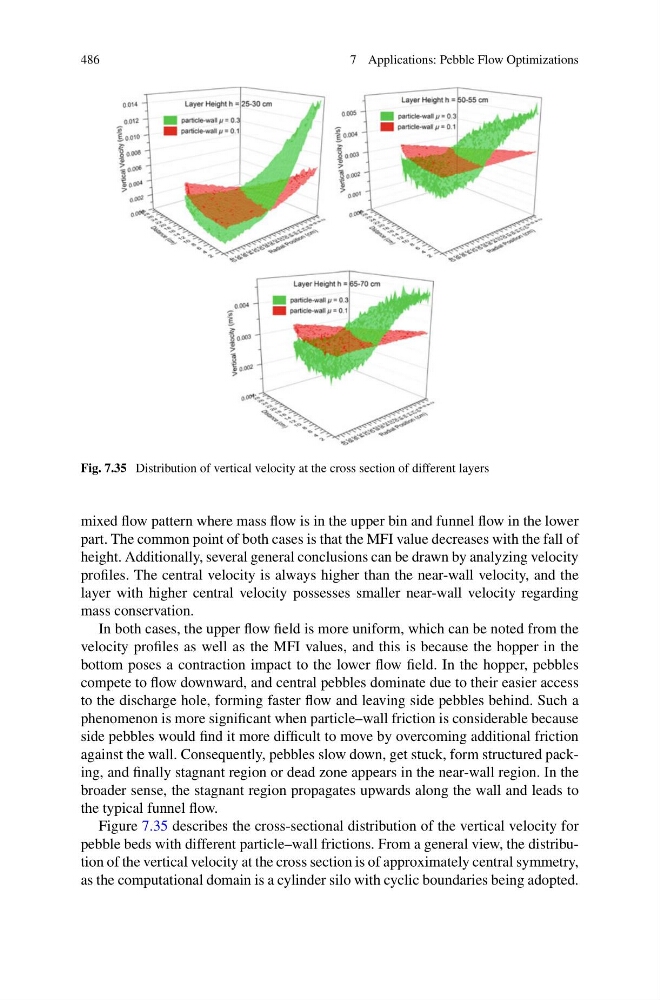
Fig. 7.35 Distribution of vertical velocity at the cross section of different layers
mixed flow pattern where mass flow is in the upper bin and funnel flow in the lower
part. The common point of both cases is that the MFI value decreases with the fall of
height. Additionally, several general conclusions can be drawn by analyzing velocity
profiles. The central velocity is always higher than the near-wall velocity, and the
layer with higher central velocity possesses smaller near-wall velocity regarding
mass conservation.
In both cases, the upper flow field is more uniform, which can be noted from the
velocity profiles as well as the MFI values, and this is because the hopper in the
bottom poses a contraction impact to the lower flow field. In the hopper, pebbles
compete to flow downward, and central pebbles dominate due to their easier access
to the discharge hole, forming faster flow and leaving side pebbles behind. Such a
phenomenon is more significant when particle–wall friction is considerable because
side pebbles would find it more difficult to move by overcoming additional friction
against the wall. Consequently, pebbles slow down, get stuck, form structured packing, and finally stagnant region or dead zone appears in the near-wall region. In the
broader sense, the stagnant region propagates upwards along the wall and leads to
the typical funnel flow.
Figure 7.35 describes the cross-sectional distribution of the vertical velocity for
pebble beds with different particle–wall frictions. From a general view, the distribution of the vertical velocity at the cross section is of approximately central symmetry,
as the computational domain is a cylinder silo with cyclic boundaries being adopted.
7 Applications: Pebble Flow Optimizations
Fig. 7.35 Distribution of vertical velocity at the cross section of different layers
mixed flow pattern where mass flow is in the upper bin and funnel flow in the lower
part. The common point of both cases is that the MFI value decreases with the fall of
height. Additionally, several general conclusions can be drawn by analyzing velocity
profiles. The central velocity is always higher than the near-wall velocity, and the
layer with higher central velocity possesses smaller near-wall velocity regarding
mass conservation.
In both cases, the upper flow field is more uniform, which can be noted from the
velocity profiles as well as the MFI values, and this is because the hopper in the
bottom poses a contraction impact to the lower flow field. In the hopper, pebbles
compete to flow downward, and central pebbles dominate due to their easier access
to the discharge hole, forming faster flow and leaving side pebbles behind. Such a
phenomenon is more significant when particle–wall friction is considerable because
side pebbles would find it more difficult to move by overcoming additional friction
against the wall. Consequently, pebbles slow down, get stuck, form structured packing, and finally stagnant region or dead zone appears in the near-wall region. In the
broader sense, the stagnant region propagates upwards along the wall and leads to
the typical funnel flow.
Figure 7.35 describes the cross-sectional distribution of the vertical velocity for
pebble beds with different particle–wall frictions. From a general view, the distribution of the vertical velocity at the cross section is of approximately central symmetry,
as the computational domain is a cylinder silo with cyclic boundaries being adopted.