

7.4 Conical Base Optimization
473
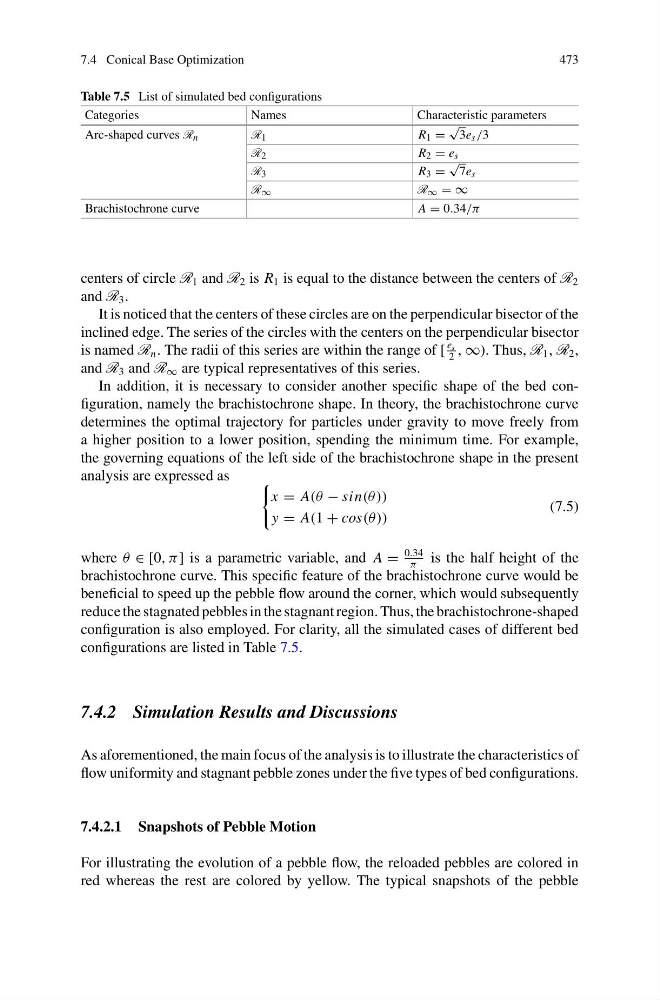
Table 7.5 List of simulated bed configurations
Categories
Names
Characteristic parameters
Arc-shaped curves R n
R 1
R 1 =
√
3e s /3
R 2
R 2 = e s
R 3
R 3 =
√
7e s
R ∞
R ∞ = ∞
Brachistochrone curve
A = 0.34/π
centers of circle R 1 and R 2 is R 1 is equal to the distance between the centers of R 2
and R 3 .
It is noticed that the centers of these circles are on the perpendicular bisector of the
inclined edge. The series of the circles with the centers on the perpendicular bisector
is named R n . The radii of this series are within the range of [
e s
2
, ∞). Thus, R 1 , R 2 ,
and R 3 and R ∞ are typical representatives of this series.
In addition, it is necessary to consider another specific shape of the bed configuration, namely the brachistochrone shape. In theory, the brachistochrone curve
determines the optimal trajectory for particles under gravity to move freely from
a higher position to a lower position, spending the minimum time. For example,
the governing equations of the left side of the brachistochrone shape in the present
analysis are expressed as
x = A(θ − sin(θ ))
y = A(1 + cos(θ ))
(7.5)
where θ ∈ [0, π] is a parametric variable, and A =
0.34
π
is the half height of the
brachistochrone curve. This specific feature of the brachistochrone curve would be
beneficial to speed up the pebble flow around the corner, which would subsequently
reduce the stagnated pebbles in the stagnant region. Thus, the brachistochrone-shaped
configuration is also employed. For clarity, all the simulated cases of different bed
configurations are listed in Table 7.5.
7.4.2 Simulation Results and Discussions
As aforementioned, the main focus of the analysis is to illustrate the characteristics of
flow uniformity and stagnant pebble zones under the five types of bed configurations.
7.4.2.1 Snapshots of Pebble Motion
For illustrating the evolution of a pebble flow, the reloaded pebbles are colored in
red whereas the rest are colored by yellow. The typical snapshots of the pebble
473
Table 7.5 List of simulated bed configurations
Categories
Names
Characteristic parameters
Arc-shaped curves R n
R 1
R 1 =
√
3e s /3
R 2
R 2 = e s
R 3
R 3 =
√
7e s
R ∞
R ∞ = ∞
Brachistochrone curve
A = 0.34/π
centers of circle R 1 and R 2 is R 1 is equal to the distance between the centers of R 2
and R 3 .
It is noticed that the centers of these circles are on the perpendicular bisector of the
inclined edge. The series of the circles with the centers on the perpendicular bisector
is named R n . The radii of this series are within the range of [
e s
2
, ∞). Thus, R 1 , R 2 ,
and R 3 and R ∞ are typical representatives of this series.
In addition, it is necessary to consider another specific shape of the bed configuration, namely the brachistochrone shape. In theory, the brachistochrone curve
determines the optimal trajectory for particles under gravity to move freely from
a higher position to a lower position, spending the minimum time. For example,
the governing equations of the left side of the brachistochrone shape in the present
analysis are expressed as
x = A(θ − sin(θ ))
y = A(1 + cos(θ ))
(7.5)
where θ ∈ [0, π] is a parametric variable, and A =
0.34
π
is the half height of the
brachistochrone curve. This specific feature of the brachistochrone curve would be
beneficial to speed up the pebble flow around the corner, which would subsequently
reduce the stagnated pebbles in the stagnant region. Thus, the brachistochrone-shaped
configuration is also employed. For clarity, all the simulated cases of different bed
configurations are listed in Table 7.5.
7.4.2 Simulation Results and Discussions
As aforementioned, the main focus of the analysis is to illustrate the characteristics of
flow uniformity and stagnant pebble zones under the five types of bed configurations.
7.4.2.1 Snapshots of Pebble Motion
For illustrating the evolution of a pebble flow, the reloaded pebbles are colored in
red whereas the rest are colored by yellow. The typical snapshots of the pebble