

7.2 Wall Structure Optimization
449
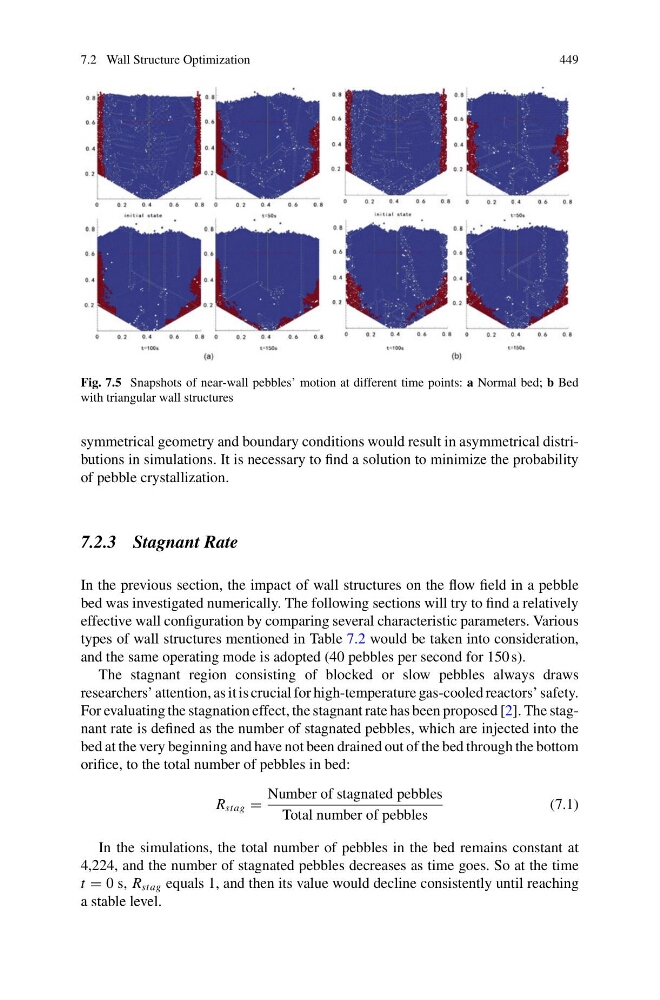
Fig. 7.5 Snapshots of near-wall pebbles’ motion at different time points: a Normal bed; b Bed
with triangular wall structures
symmetrical geometry and boundary conditions would result in asymmetrical distributions in simulations. It is necessary to find a solution to minimize the probability
of pebble crystallization.
7.2.3 Stagnant Rate
In the previous section, the impact of wall structures on the flow field in a pebble
bed was investigated numerically. The following sections will try to find a relatively
effective wall configuration by comparing several characteristic parameters. Various
types of wall structures mentioned in Table 7.2 would be taken into consideration,
and the same operating mode is adopted (40 pebbles per second for 150 s).
The stagnant region consisting of blocked or slow pebbles always draws
researchers’ attention, as it is crucial for high-temperature gas-cooled reactors’ safety.
For evaluating the stagnation effect, the stagnant rate has been proposed [2]. The stagnant rate is defined as the number of stagnated pebbles, which are injected into the
bed at the very beginning and have not been drained out of the bed through the bottom
orifice, to the total number of pebbles in bed:
R stag =
Number of stagnated pebbles
Total number of pebbles
(7.1)
In the simulations, the total number of pebbles in the bed remains constant at
4,224, and the number of stagnated pebbles decreases as time goes. So at the time
t = 0 s, R stag equals 1, and then its value would decline consistently until reaching
a stable level.
449
Fig. 7.5 Snapshots of near-wall pebbles’ motion at different time points: a Normal bed; b Bed
with triangular wall structures
symmetrical geometry and boundary conditions would result in asymmetrical distributions in simulations. It is necessary to find a solution to minimize the probability
of pebble crystallization.
7.2.3 Stagnant Rate
In the previous section, the impact of wall structures on the flow field in a pebble
bed was investigated numerically. The following sections will try to find a relatively
effective wall configuration by comparing several characteristic parameters. Various
types of wall structures mentioned in Table 7.2 would be taken into consideration,
and the same operating mode is adopted (40 pebbles per second for 150 s).
The stagnant region consisting of blocked or slow pebbles always draws
researchers’ attention, as it is crucial for high-temperature gas-cooled reactors’ safety.
For evaluating the stagnation effect, the stagnant rate has been proposed [2]. The stagnant rate is defined as the number of stagnated pebbles, which are injected into the
bed at the very beginning and have not been drained out of the bed through the bottom
orifice, to the total number of pebbles in bed:
R stag =
Number of stagnated pebbles
Total number of pebbles
(7.1)
In the simulations, the total number of pebbles in the bed remains constant at
4,224, and the number of stagnated pebbles decreases as time goes. So at the time
t = 0 s, R stag equals 1, and then its value would decline consistently until reaching
a stable level.