

444
7 Applications: Pebble Flow Optimizations
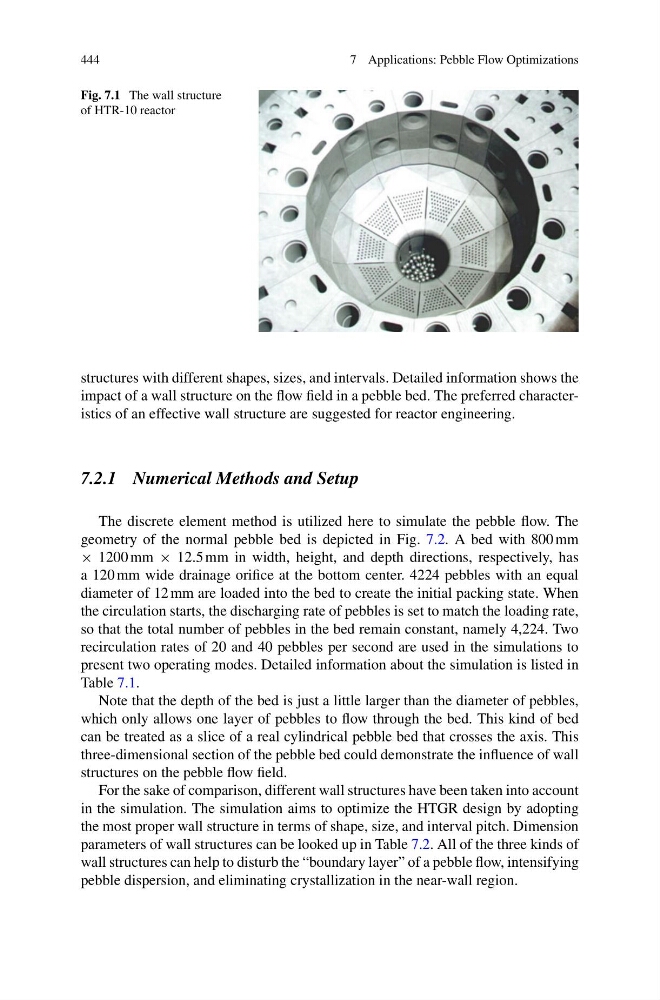
Fig. 7.1 The wall structure
of HTR-10 reactor
structures with different shapes, sizes, and intervals. Detailed information shows the
impact of a wall structure on the flow field in a pebble bed. The preferred characteristics of an effective wall structure are suggested for reactor engineering.
7.2.1 Numerical Methods and Setup
The discrete element method is utilized here to simulate the pebble flow. The
geometry of the normal pebble bed is depicted in Fig. 7.2. A bed with 800 mm
× 1200 mm × 12.5 mm in width, height, and depth directions, respectively, has
a 120 mm wide drainage orifice at the bottom center. 4224 pebbles with an equal
diameter of 12 mm are loaded into the bed to create the initial packing state. When
the circulation starts, the discharging rate of pebbles is set to match the loading rate,
so that the total number of pebbles in the bed remain constant, namely 4,224. Two
recirculation rates of 20 and 40 pebbles per second are used in the simulations to
present two operating modes. Detailed information about the simulation is listed in
Table 7.1.
Note that the depth of the bed is just a little larger than the diameter of pebbles,
which only allows one layer of pebbles to flow through the bed. This kind of bed
can be treated as a slice of a real cylindrical pebble bed that crosses the axis. This
three-dimensional section of the pebble bed could demonstrate the influence of wall
structures on the pebble flow field.
For the sake of comparison, different wall structures have been taken into account
in the simulation. The simulation aims to optimize the HTGR design by adopting
the most proper wall structure in terms of shape, size, and interval pitch. Dimension
parameters of wall structures can be looked up in Table 7.2. All of the three kinds of
wall structures can help to disturb the “boundary layer” of a pebble flow, intensifying
pebble dispersion, and eliminating crystallization in the near-wall region.
7 Applications: Pebble Flow Optimizations
Fig. 7.1 The wall structure
of HTR-10 reactor
structures with different shapes, sizes, and intervals. Detailed information shows the
impact of a wall structure on the flow field in a pebble bed. The preferred characteristics of an effective wall structure are suggested for reactor engineering.
7.2.1 Numerical Methods and Setup
The discrete element method is utilized here to simulate the pebble flow. The
geometry of the normal pebble bed is depicted in Fig. 7.2. A bed with 800 mm
× 1200 mm × 12.5 mm in width, height, and depth directions, respectively, has
a 120 mm wide drainage orifice at the bottom center. 4224 pebbles with an equal
diameter of 12 mm are loaded into the bed to create the initial packing state. When
the circulation starts, the discharging rate of pebbles is set to match the loading rate,
so that the total number of pebbles in the bed remain constant, namely 4,224. Two
recirculation rates of 20 and 40 pebbles per second are used in the simulations to
present two operating modes. Detailed information about the simulation is listed in
Table 7.1.
Note that the depth of the bed is just a little larger than the diameter of pebbles,
which only allows one layer of pebbles to flow through the bed. This kind of bed
can be treated as a slice of a real cylindrical pebble bed that crosses the axis. This
three-dimensional section of the pebble bed could demonstrate the influence of wall
structures on the pebble flow field.
For the sake of comparison, different wall structures have been taken into account
in the simulation. The simulation aims to optimize the HTGR design by adopting
the most proper wall structure in terms of shape, size, and interval pitch. Dimension
parameters of wall structures can be looked up in Table 7.2. All of the three kinds of
wall structures can help to disturb the “boundary layer” of a pebble flow, intensifying
pebble dispersion, and eliminating crystallization in the near-wall region.