

412
6 Applications: Two-Region Pebble Beds
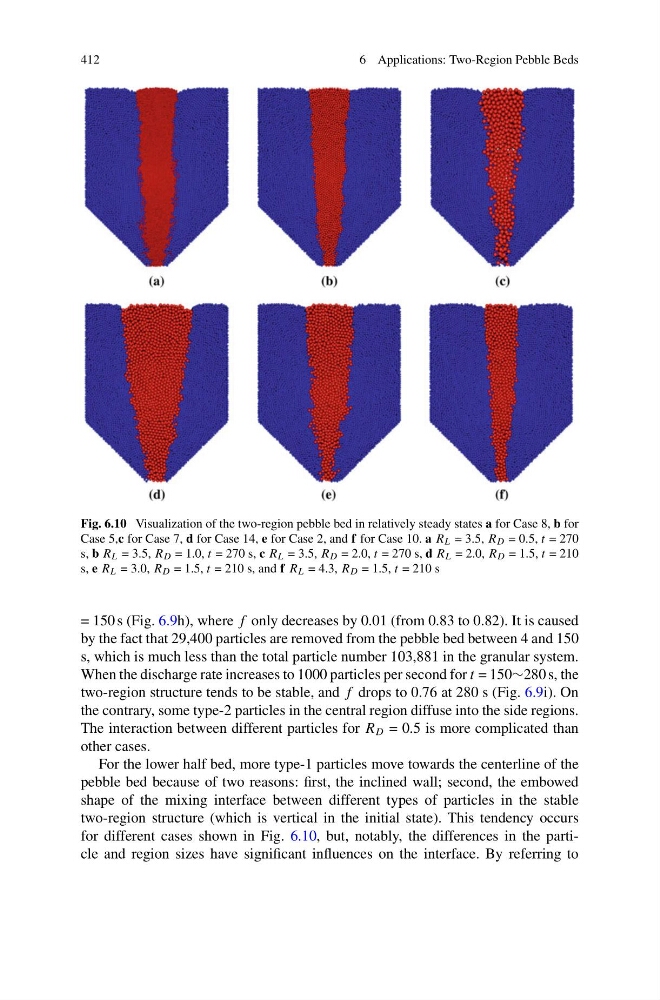
Fig. 6.10 Visualization of the two-region pebble bed in relatively steady states a for Case 8, b for
Case 5,c for Case 7, d for Case 14, e for Case 2, and f for Case 10. a R L = 3.5, R D = 0.5, t = 270
s, b R L = 3.5, R D = 1.0, t = 270 s, c R L = 3.5, R D = 2.0, t = 270 s, d R L = 2.0, R D = 1.5, t = 210
s, e R L = 3.0, R D = 1.5, t = 210 s, and f R L = 4.3, R D = 1.5, t = 210 s
= 150 s (Fig. 6.9h), where f only decreases by 0.01 (from 0.83 to 0.82). It is caused
by the fact that 29,400 particles are removed from the pebble bed between 4 and 150
s, which is much less than the total particle number 103,881 in the granular system.
When the discharge rate increases to 1000 particles per second for t = 150∼280 s, the
two-region structure tends to be stable, and f drops to 0.76 at 280 s (Fig. 6.9i). On
the contrary, some type-2 particles in the central region diffuse into the side regions.
The interaction between different particles for R D = 0.5 is more complicated than
other cases.
For the lower half bed, more type-1 particles move towards the centerline of the
pebble bed because of two reasons: first, the inclined wall; second, the embowed
shape of the mixing interface between different types of particles in the stable
two-region structure (which is vertical in the initial state). This tendency occurs
for different cases shown in Fig. 6.10, but, notably, the differences in the particle and region sizes have significant influences on the interface. By referring to
6 Applications: Two-Region Pebble Beds
Fig. 6.10 Visualization of the two-region pebble bed in relatively steady states a for Case 8, b for
Case 5,c for Case 7, d for Case 14, e for Case 2, and f for Case 10. a R L = 3.5, R D = 0.5, t = 270
s, b R L = 3.5, R D = 1.0, t = 270 s, c R L = 3.5, R D = 2.0, t = 270 s, d R L = 2.0, R D = 1.5, t = 210
s, e R L = 3.0, R D = 1.5, t = 210 s, and f R L = 4.3, R D = 1.5, t = 210 s
= 150 s (Fig. 6.9h), where f only decreases by 0.01 (from 0.83 to 0.82). It is caused
by the fact that 29,400 particles are removed from the pebble bed between 4 and 150
s, which is much less than the total particle number 103,881 in the granular system.
When the discharge rate increases to 1000 particles per second for t = 150∼280 s, the
two-region structure tends to be stable, and f drops to 0.76 at 280 s (Fig. 6.9i). On
the contrary, some type-2 particles in the central region diffuse into the side regions.
The interaction between different particles for R D = 0.5 is more complicated than
other cases.
For the lower half bed, more type-1 particles move towards the centerline of the
pebble bed because of two reasons: first, the inclined wall; second, the embowed
shape of the mixing interface between different types of particles in the stable
two-region structure (which is vertical in the initial state). This tendency occurs
for different cases shown in Fig. 6.10, but, notably, the differences in the particle and region sizes have significant influences on the interface. By referring to