

4.3 Three-Dimensional Pebble Flow
205
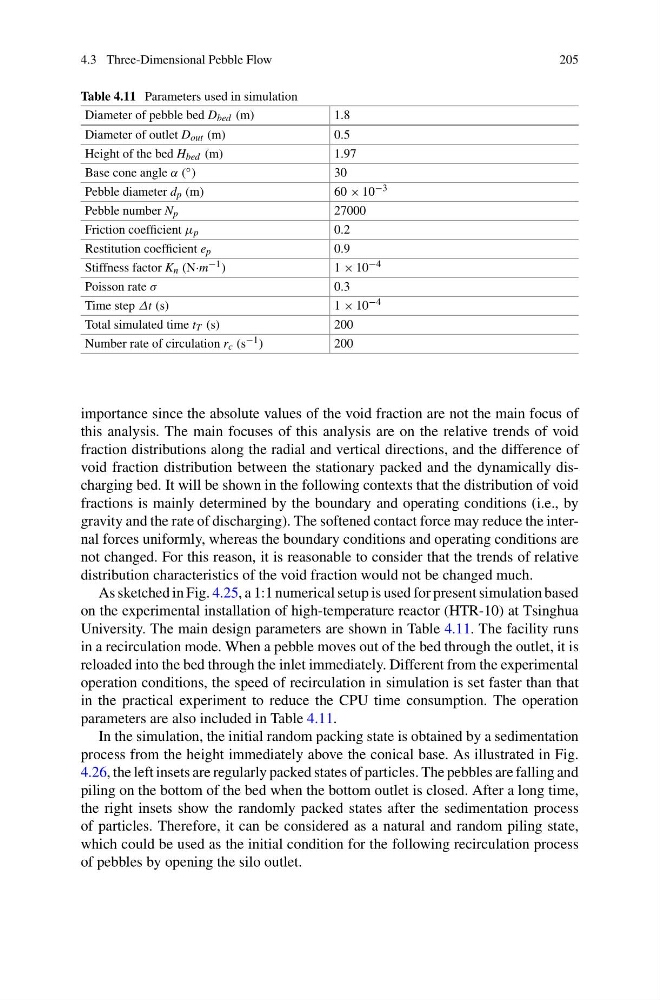
Table 4.11 Parameters used in simulation
Diameter of pebble bed D bed (m)
1.8
Diameter of outlet D out (m)
0.5
Height of the bed H bed (m)
1.97
Base cone angle α ( ◦ )
30
Pebble diameter d p (m)
60 × 10 −3
Pebble number N p
27000
Friction coefficient μ p
0.2
Restitution coefficient e p
0.9
Stiffness factor K n (N·m −1 )
1 × 10 −4
Poisson rate σ
0.3
Time step Δt (s)
1 × 10 −4
Total simulated time t T (s)
200
Number rate of circulation r c (s −1 )
200
importance since the absolute values of the void fraction are not the main focus of
this analysis. The main focuses of this analysis are on the relative trends of void
fraction distributions along the radial and vertical directions, and the difference of
void fraction distribution between the stationary packed and the dynamically discharging bed. It will be shown in the following contexts that the distribution of void
fractions is mainly determined by the boundary and operating conditions (i.e., by
gravity and the rate of discharging). The softened contact force may reduce the internal forces uniformly, whereas the boundary conditions and operating conditions are
not changed. For this reason, it is reasonable to consider that the trends of relative
distribution characteristics of the void fraction would not be changed much.
As sketched in Fig. 4.25, a 1:1 numerical setup is used for present simulation based
on the experimental installation of high-temperature reactor (HTR-10) at Tsinghua
University. The main design parameters are shown in Table 4.11. The facility runs
in a recirculation mode. When a pebble moves out of the bed through the outlet, it is
reloaded into the bed through the inlet immediately. Different from the experimental
operation conditions, the speed of recirculation in simulation is set faster than that
in the practical experiment to reduce the CPU time consumption. The operation
parameters are also included in Table 4.11.
In the simulation, the initial random packing state is obtained by a sedimentation
process from the height immediately above the conical base. As illustrated in Fig.
4.26, the left insets are regularly packed states of particles. The pebbles are falling and
piling on the bottom of the bed when the bottom outlet is closed. After a long time,
the right insets show the randomly packed states after the sedimentation process
of particles. Therefore, it can be considered as a natural and random piling state,
which could be used as the initial condition for the following recirculation process
of pebbles by opening the silo outlet.
205
Table 4.11 Parameters used in simulation
Diameter of pebble bed D bed (m)
1.8
Diameter of outlet D out (m)
0.5
Height of the bed H bed (m)
1.97
Base cone angle α ( ◦ )
30
Pebble diameter d p (m)
60 × 10 −3
Pebble number N p
27000
Friction coefficient μ p
0.2
Restitution coefficient e p
0.9
Stiffness factor K n (N·m −1 )
1 × 10 −4
Poisson rate σ
0.3
Time step Δt (s)
1 × 10 −4
Total simulated time t T (s)
200
Number rate of circulation r c (s −1 )
200
importance since the absolute values of the void fraction are not the main focus of
this analysis. The main focuses of this analysis are on the relative trends of void
fraction distributions along the radial and vertical directions, and the difference of
void fraction distribution between the stationary packed and the dynamically discharging bed. It will be shown in the following contexts that the distribution of void
fractions is mainly determined by the boundary and operating conditions (i.e., by
gravity and the rate of discharging). The softened contact force may reduce the internal forces uniformly, whereas the boundary conditions and operating conditions are
not changed. For this reason, it is reasonable to consider that the trends of relative
distribution characteristics of the void fraction would not be changed much.
As sketched in Fig. 4.25, a 1:1 numerical setup is used for present simulation based
on the experimental installation of high-temperature reactor (HTR-10) at Tsinghua
University. The main design parameters are shown in Table 4.11. The facility runs
in a recirculation mode. When a pebble moves out of the bed through the outlet, it is
reloaded into the bed through the inlet immediately. Different from the experimental
operation conditions, the speed of recirculation in simulation is set faster than that
in the practical experiment to reduce the CPU time consumption. The operation
parameters are also included in Table 4.11.
In the simulation, the initial random packing state is obtained by a sedimentation
process from the height immediately above the conical base. As illustrated in Fig.
4.26, the left insets are regularly packed states of particles. The pebbles are falling and
piling on the bottom of the bed when the bottom outlet is closed. After a long time,
the right insets show the randomly packed states after the sedimentation process
of particles. Therefore, it can be considered as a natural and random piling state,
which could be used as the initial condition for the following recirculation process
of pebbles by opening the silo outlet.