

4.2 Gravity-Driven Flow Regime Characterization
197
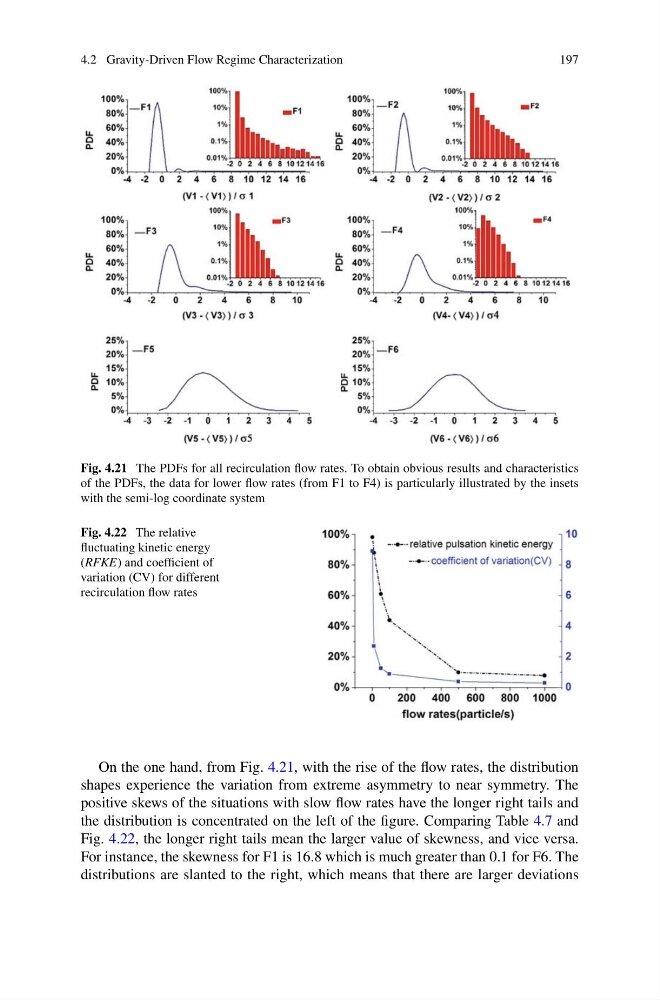
Fig. 4.21 The PDFs for all recirculation flow rates. To obtain obvious results and characteristics
of the PDFs, the data for lower flow rates (from F1 to F4) is particularly illustrated by the insets
with the semi-log coordinate system
Fig. 4.22 The relative
fluctuating kinetic energy
(RFKE) and coefficient of
variation (CV) for different
recirculation flow rates
On the one hand, from Fig. 4.21, with the rise of the flow rates, the distribution
shapes experience the variation from extreme asymmetry to near symmetry. The
positive skews of the situations with slow flow rates have the longer right tails and
the distribution is concentrated on the left of the figure. Comparing Table 4.7 and
Fig. 4.22, the longer right tails mean the larger value of skewness, and vice versa.
For instance, the skewness for F1 is 16.8 which is much greater than 0.1 for F6. The
distributions are slanted to the right, which means that there are larger deviations
197
Fig. 4.21 The PDFs for all recirculation flow rates. To obtain obvious results and characteristics
of the PDFs, the data for lower flow rates (from F1 to F4) is particularly illustrated by the insets
with the semi-log coordinate system
Fig. 4.22 The relative
fluctuating kinetic energy
(RFKE) and coefficient of
variation (CV) for different
recirculation flow rates
On the one hand, from Fig. 4.21, with the rise of the flow rates, the distribution
shapes experience the variation from extreme asymmetry to near symmetry. The
positive skews of the situations with slow flow rates have the longer right tails and
the distribution is concentrated on the left of the figure. Comparing Table 4.7 and
Fig. 4.22, the longer right tails mean the larger value of skewness, and vice versa.
For instance, the skewness for F1 is 16.8 which is much greater than 0.1 for F6. The
distributions are slanted to the right, which means that there are larger deviations