

170
4 Numerical Methods and Simulation for Pebble Flows
some time, the sudden change of large-scale structure takes place, which behaves
like an internal “quake” of the particle assembly. This sudden change is always
accompanied by the internal bulk motion of falling, during which the overall
magnitude of the mean velocity of particles must increase.
On the contrary, after the internal “bulk motion of falling”, the particles are packed
under a relatively tight degree inside the bottom region once again (see Fig. 4.4b, d),
which makes a subsequent sudden increase of the magnitude of mean contact force.
This explains why the sudden impulse feature of the mean force and velocity tends
to occur at the same time (e.g., pre- and post- t 1 or t 2 ).
It can be concluded from Fig. 4.4, that the gravity-driven particle flow is intrinsically intermittent because the flow and internal structure cannot respond to the
instantaneous variation of timely particle discharge. The force structure instability
always varies gradually, while the large-scale structure change of forces usually happens suddenly and intermittently. This means that a delayed response always causes
sudden internal changes in essential characteristics of particle flows.
4.2.2 Kinetic Versus Kinematic
4.2.2.1 Time Derivative and Correlation
In general, a bulk motion of falling is accompanied by a pre-increase of velocity and
a post-increase of contact force. Therefore, the variation of mean force and velocity
may be correlated to each other. Although there are variations of magnitudes of
the mean force and velocity (see Fig. 4.3), the time derivatives may not display
significant variations. Thus, the time derivatives are suitable indicators to detect the
sudden change of physical parameters, which better represent the change of essential
flow characteristics.
Figure 4.5a, b illustrate the time derivative of mean force ˙
F and time variation
of mean velocity V for R d = 6000 and 600 particles/min respectively. The variation
of ˙
F is observed to be fairly correlated with the variation of V . The peaks of ˙
F
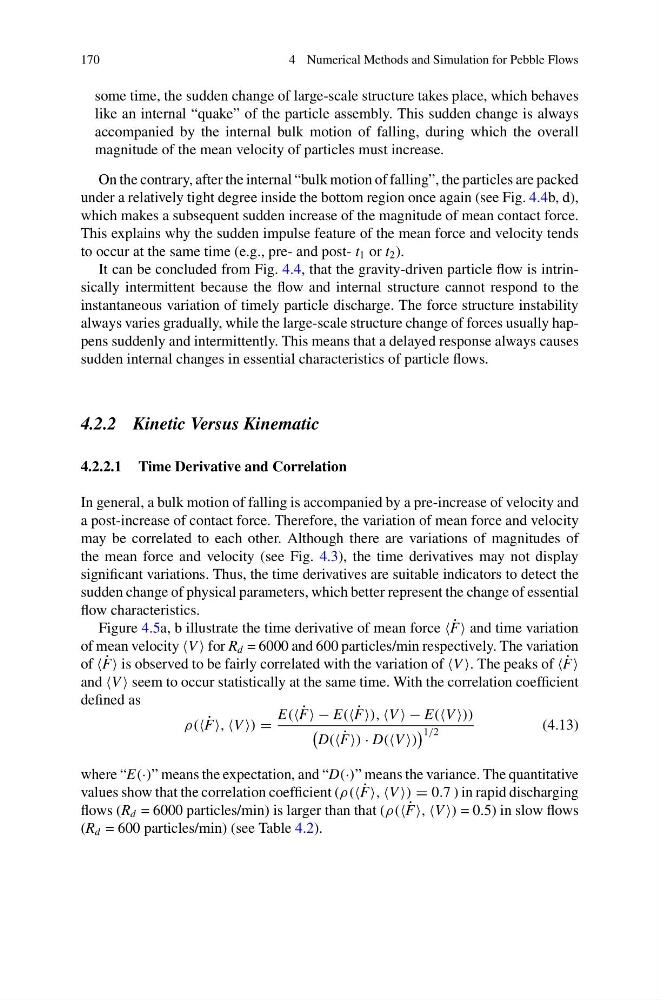
and V seem to occur statistically at the same time. With the correlation coefficient
defined as
ρ( ˙
F, V ) =
E( ˙
F − E( ˙
F), V − E(V ))
D( ˙
F) · D(V )
1/2
(4.13)
where “E(·)” means the expectation, and “D(·)” means the variance. The quantitative
values show that the correlation coefficient (ρ( ˙
F, V ) = 0.7 ) in rapid discharging
flows (R d = 6000 particles/min) is larger than that (ρ( ˙
F, V ) = 0.5) in slow flows
(R d = 600 particles/min) (see Table 4.2).
4 Numerical Methods and Simulation for Pebble Flows
some time, the sudden change of large-scale structure takes place, which behaves
like an internal “quake” of the particle assembly. This sudden change is always
accompanied by the internal bulk motion of falling, during which the overall
magnitude of the mean velocity of particles must increase.
On the contrary, after the internal “bulk motion of falling”, the particles are packed
under a relatively tight degree inside the bottom region once again (see Fig. 4.4b, d),
which makes a subsequent sudden increase of the magnitude of mean contact force.
This explains why the sudden impulse feature of the mean force and velocity tends
to occur at the same time (e.g., pre- and post- t 1 or t 2 ).
It can be concluded from Fig. 4.4, that the gravity-driven particle flow is intrinsically intermittent because the flow and internal structure cannot respond to the
instantaneous variation of timely particle discharge. The force structure instability
always varies gradually, while the large-scale structure change of forces usually happens suddenly and intermittently. This means that a delayed response always causes
sudden internal changes in essential characteristics of particle flows.
4.2.2 Kinetic Versus Kinematic
4.2.2.1 Time Derivative and Correlation
In general, a bulk motion of falling is accompanied by a pre-increase of velocity and
a post-increase of contact force. Therefore, the variation of mean force and velocity
may be correlated to each other. Although there are variations of magnitudes of
the mean force and velocity (see Fig. 4.3), the time derivatives may not display
significant variations. Thus, the time derivatives are suitable indicators to detect the
sudden change of physical parameters, which better represent the change of essential
flow characteristics.
Figure 4.5a, b illustrate the time derivative of mean force ˙
F and time variation
of mean velocity V for R d = 6000 and 600 particles/min respectively. The variation
of ˙
F is observed to be fairly correlated with the variation of V . The peaks of ˙
F
and V seem to occur statistically at the same time. With the correlation coefficient
defined as
ρ( ˙
F, V ) =
E( ˙
F − E( ˙
F), V − E(V ))
D( ˙
F) · D(V )
1/2
(4.13)
where “E(·)” means the expectation, and “D(·)” means the variance. The quantitative
values show that the correlation coefficient (ρ( ˙
F, V ) = 0.7 ) in rapid discharging
flows (R d = 6000 particles/min) is larger than that (ρ( ˙
F, V ) = 0.5) in slow flows
(R d = 600 particles/min) (see Table 4.2).