

166
4 Numerical Methods and Simulation for Pebble Flows
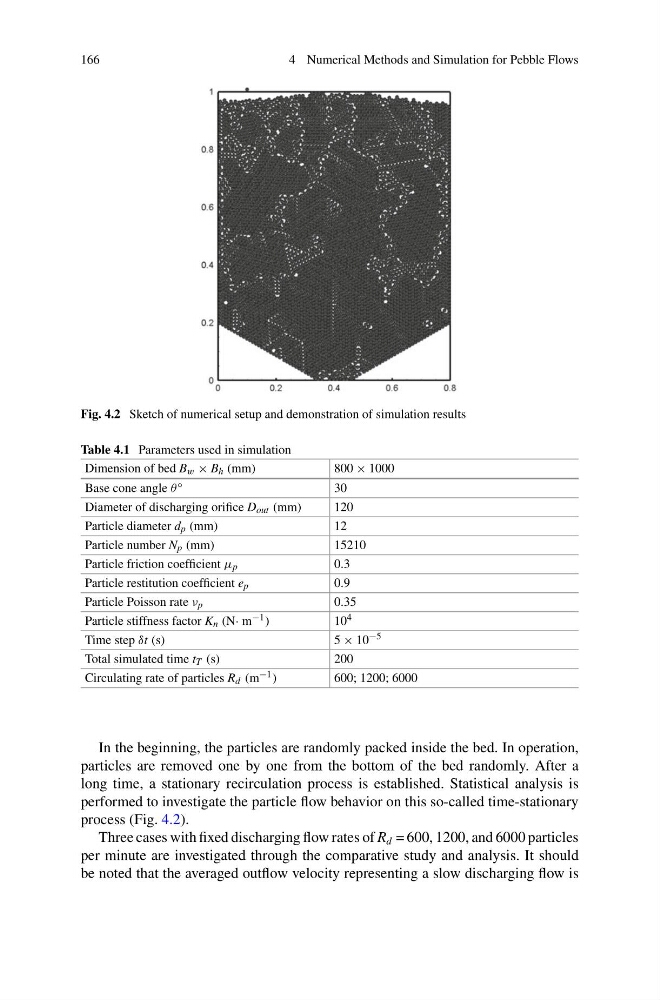
Fig. 4.2 Sketch of numerical setup and demonstration of simulation results
Table 4.1 Parameters used in simulation
Dimension of bed B w × B h (mm)
800 × 1000
Base cone angle θ ◦
30
Diameter of discharging orifice D out (mm)
120
Particle diameter d p (mm)
12
Particle number N p (mm)
15210
Particle friction coefficient μ p
0.3
Particle restitution coefficient e p
0.9
Particle Poisson rate ν p
0.35
Particle stiffness factor K n (N· m −1 )
10 4
Time step δt (s)
5 × 10 −5
Total simulated time t T (s)
200
Circulating rate of particles R d (m −1 )
600; 1200; 6000
In the beginning, the particles are randomly packed inside the bed. In operation,
particles are removed one by one from the bottom of the bed randomly. After a
long time, a stationary recirculation process is established. Statistical analysis is
performed to investigate the particle flow behavior on this so-called time-stationary
process (Fig. 4.2).
Three cases with fixed discharging flow rates of R d = 600, 1200, and 6000 particles
per minute are investigated through the comparative study and analysis. It should
be noted that the averaged outflow velocity representing a slow discharging flow is
4 Numerical Methods and Simulation for Pebble Flows
Fig. 4.2 Sketch of numerical setup and demonstration of simulation results
Table 4.1 Parameters used in simulation
Dimension of bed B w × B h (mm)
800 × 1000
Base cone angle θ ◦
30
Diameter of discharging orifice D out (mm)
120
Particle diameter d p (mm)
12
Particle number N p (mm)
15210
Particle friction coefficient μ p
0.3
Particle restitution coefficient e p
0.9
Particle Poisson rate ν p
0.35
Particle stiffness factor K n (N· m −1 )
10 4
Time step δt (s)
5 × 10 −5
Total simulated time t T (s)
200
Circulating rate of particles R d (m −1 )
600; 1200; 6000
In the beginning, the particles are randomly packed inside the bed. In operation,
particles are removed one by one from the bottom of the bed randomly. After a
long time, a stationary recirculation process is established. Statistical analysis is
performed to investigate the particle flow behavior on this so-called time-stationary
process (Fig. 4.2).
Three cases with fixed discharging flow rates of R d = 600, 1200, and 6000 particles
per minute are investigated through the comparative study and analysis. It should
be noted that the averaged outflow velocity representing a slow discharging flow is