

114
2 Experiments in Pebble Flows
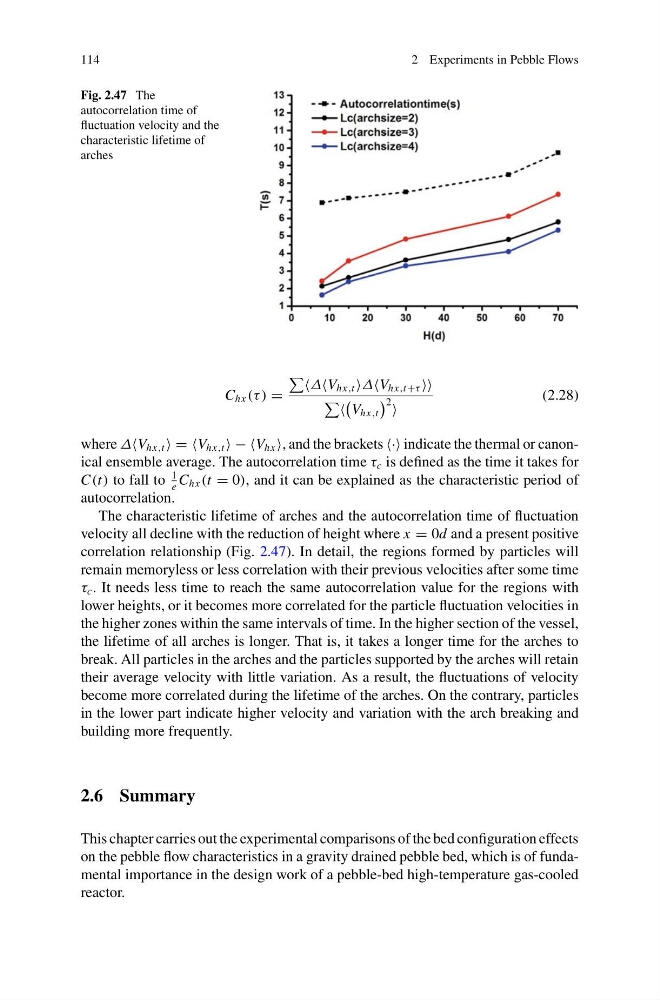
Fig. 2.47 The
autocorrelation time of
fluctuation velocity and the
characteristic lifetime of
arches
C hx (τ ) =
ΔV hx,t ΔV hx,t+τ
V hx,t
2
(2.28)
where ΔV hx,t = =V hx,t − −V hx , and the brackets ·· indicate the thermal or canonical ensemble average. The autocorrelation time τ c is defined as the time it takes for
C(t) to fall to
1
e
C hx (t = 0), and it can be explained as the characteristic period of
autocorrelation.
The characteristic lifetime of arches and the autocorrelation time of fluctuation
velocity all decline with the reduction of height where x = 0d and a present positive
correlation relationship (Fig. 2.47). In detail, the regions formed by particles will
remain memoryless or less correlation with their previous velocities after some time
τ c . It needs less time to reach the same autocorrelation value for the regions with
lower heights, or it becomes more correlated for the particle fluctuation velocities in
the higher zones within the same intervals of time. In the higher section of the vessel,
the lifetime of all arches is longer. That is, it takes a longer time for the arches to
break. All particles in the arches and the particles supported by the arches will retain
their average velocity with little variation. As a result, the fluctuations of velocity
become more correlated during the lifetime of the arches. On the contrary, particles
in the lower part indicate higher velocity and variation with the arch breaking and
building more frequently.
2.6 Summary
This chapter carries out the experimental comparisons of the bed configuration effects
on the pebble flow characteristics in a gravity drained pebble bed, which is of fundamental importance in the design work of a pebble-bed high-temperature gas-cooled
reactor.
2 Experiments in Pebble Flows
Fig. 2.47 The
autocorrelation time of
fluctuation velocity and the
characteristic lifetime of
arches
C hx (τ ) =
ΔV hx,t ΔV hx,t+τ
V hx,t
2
(2.28)
where ΔV hx,t = =V hx,t − −V hx , and the brackets ·· indicate the thermal or canonical ensemble average. The autocorrelation time τ c is defined as the time it takes for
C(t) to fall to
1
e
C hx (t = 0), and it can be explained as the characteristic period of
autocorrelation.
The characteristic lifetime of arches and the autocorrelation time of fluctuation
velocity all decline with the reduction of height where x = 0d and a present positive
correlation relationship (Fig. 2.47). In detail, the regions formed by particles will
remain memoryless or less correlation with their previous velocities after some time
τ c . It needs less time to reach the same autocorrelation value for the regions with
lower heights, or it becomes more correlated for the particle fluctuation velocities in
the higher zones within the same intervals of time. In the higher section of the vessel,
the lifetime of all arches is longer. That is, it takes a longer time for the arches to
break. All particles in the arches and the particles supported by the arches will retain
their average velocity with little variation. As a result, the fluctuations of velocity
become more correlated during the lifetime of the arches. On the contrary, particles
in the lower part indicate higher velocity and variation with the arch breaking and
building more frequently.
2.6 Summary
This chapter carries out the experimental comparisons of the bed configuration effects
on the pebble flow characteristics in a gravity drained pebble bed, which is of fundamental importance in the design work of a pebble-bed high-temperature gas-cooled
reactor.