

112
2 Experiments in Pebble Flows
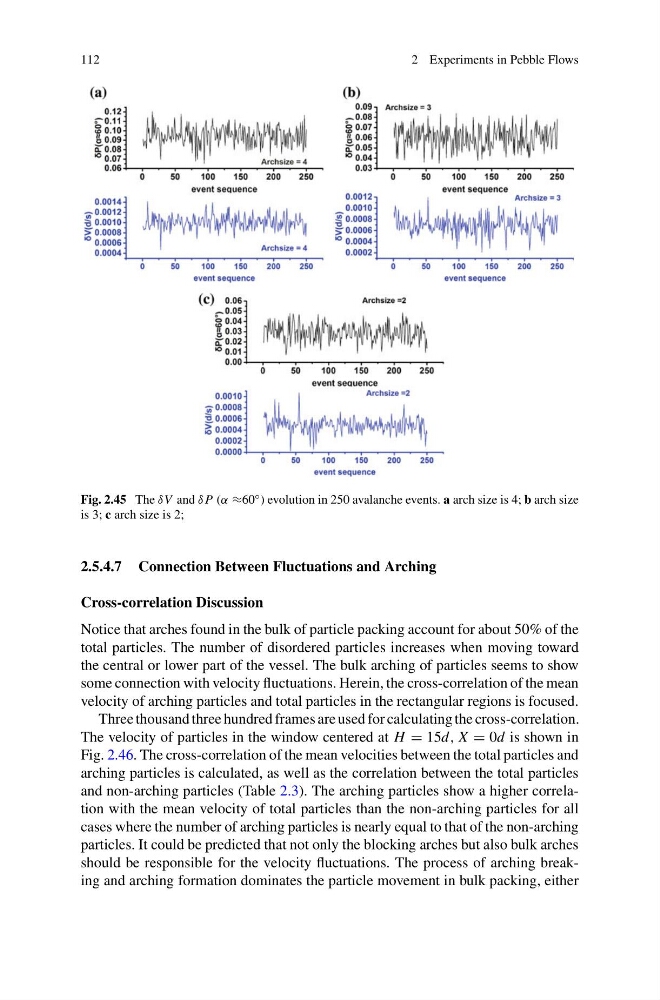
Fig. 2.45 The δV and δ P (α ≈60 ◦ ) evolution in 250 avalanche events. a arch size is 4; b arch size
is 3; c arch size is 2;
2.5.4.7 Connection Between Fluctuations and Arching
Cross-correlation Discussion
Notice that arches found in the bulk of particle packing account for about 50% of the
total particles. The number of disordered particles increases when moving toward
the central or lower part of the vessel. The bulk arching of particles seems to show
some connection with velocity fluctuations. Herein, the cross-correlation of the mean
velocity of arching particles and total particles in the rectangular regions is focused.
Three thousand three hundred frames are used for calculating the cross-correlation.
The velocity of particles in the window centered at H = 15d, X = 0d is shown in
Fig. 2.46. The cross-correlation of the mean velocities between the total particles and
arching particles is calculated, as well as the correlation between the total particles
and non-arching particles (Table 2.3). The arching particles show a higher correlation with the mean velocity of total particles than the non-arching particles for all
cases where the number of arching particles is nearly equal to that of the non-arching
particles. It could be predicted that not only the blocking arches but also bulk arches
should be responsible for the velocity fluctuations. The process of arching breaking and arching formation dominates the particle movement in bulk packing, either
2 Experiments in Pebble Flows
Fig. 2.45 The δV and δ P (α ≈60 ◦ ) evolution in 250 avalanche events. a arch size is 4; b arch size
is 3; c arch size is 2;
2.5.4.7 Connection Between Fluctuations and Arching
Cross-correlation Discussion
Notice that arches found in the bulk of particle packing account for about 50% of the
total particles. The number of disordered particles increases when moving toward
the central or lower part of the vessel. The bulk arching of particles seems to show
some connection with velocity fluctuations. Herein, the cross-correlation of the mean
velocity of arching particles and total particles in the rectangular regions is focused.
Three thousand three hundred frames are used for calculating the cross-correlation.
The velocity of particles in the window centered at H = 15d, X = 0d is shown in
Fig. 2.46. The cross-correlation of the mean velocities between the total particles and
arching particles is calculated, as well as the correlation between the total particles
and non-arching particles (Table 2.3). The arching particles show a higher correlation with the mean velocity of total particles than the non-arching particles for all
cases where the number of arching particles is nearly equal to that of the non-arching
particles. It could be predicted that not only the blocking arches but also bulk arches
should be responsible for the velocity fluctuations. The process of arching breaking and arching formation dominates the particle movement in bulk packing, either