

2.5 Particle Velocimetry Measurements
101
performed. The pairing efficiency is examined by Φ y and Φ r . Φ y is the ratio of
measured particles (N m ) to the total number (N a ) in VSJ#302. Φ r is the ratio of
correctly identified particles (N c ) (within 1 pixel error from the accurate position)
to the total measured particles (N m ). Moreover, the average value of position e xy is
defined in Eqs. (2.25) and (2.26):
e xy =
1
N c
N c
i=1
((x m (i) − x a ) 2 + (y m (i) − y a ) 2 ),
(2.25)
where “m” means the measured and “a” means the accurate results. A sharp decrease
in the percentage of detected particles with position errors e xy from 0.1 to 1 pixel is
shown in Fig. 2.34b. High reliabilities (near 95.6%) and small errors are also indicated
in Fig. 2.34c. In summary, the accuracy of the DTB method has been demonstrated
with high reliability and precision.
Furthermore, it is needed to pay attention to the phenomenon that a single particle
experiences an avalanche while its neighbor particles move very slowly or even stay
stationary. In this case, it is probable for the RM method to fail to detect the avalanche
motion which is probably regarded as the no-matching or partner loss. As mentioned
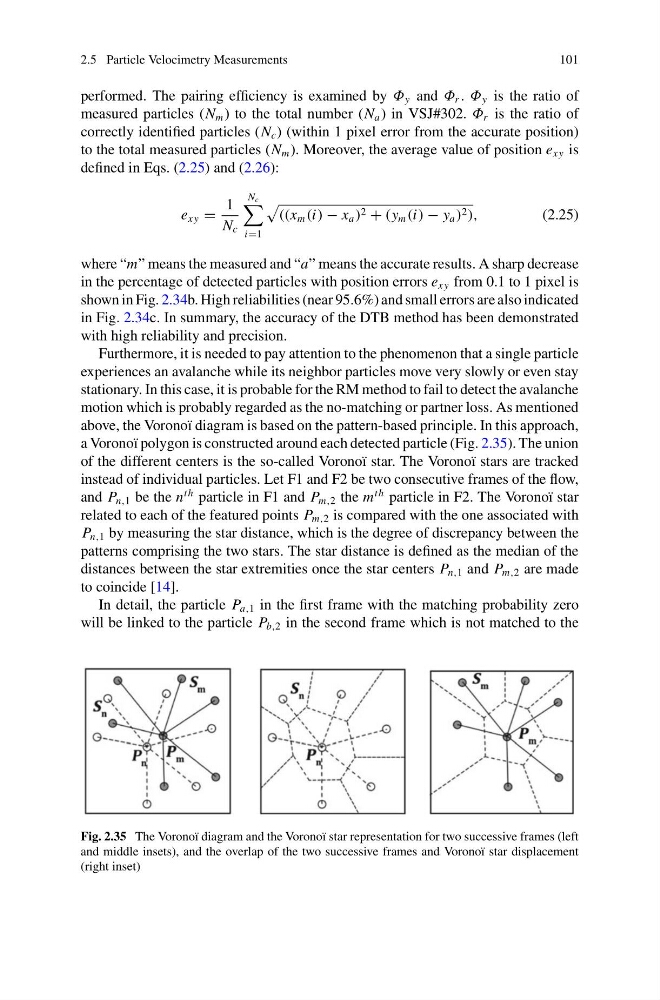
above, the Voronoï diagram is based on the pattern-based principle. In this approach,
a Voronoï polygon is constructed around each detected particle (Fig. 2.35). The union
of the different centers is the so-called Voronoï star. The Voronoï stars are tracked
instead of individual particles. Let F1 and F2 be two consecutive frames of the flow,
and P n,1 be the n
th particle in F1 and P m,2 the m
th particle in F2. The Voronoï star
related to each of the featured points P m,2 is compared with the one associated with
P n,1 by measuring the star distance, which is the degree of discrepancy between the
patterns comprising the two stars. The star distance is defined as the median of the
distances between the star extremities once the star centers P n,1 and P m,2 are made
to coincide [14].
In detail, the particle P a,1 in the first frame with the matching probability zero
will be linked to the particle P b,2 in the second frame which is not matched to the
Fig. 2.35 The Voronoï diagram and the Voronoï star representation for two successive frames (left
and middle insets), and the overlap of the two successive frames and Voronoï star displacement
(right inset)
101
performed. The pairing efficiency is examined by Φ y and Φ r . Φ y is the ratio of
measured particles (N m ) to the total number (N a ) in VSJ#302. Φ r is the ratio of
correctly identified particles (N c ) (within 1 pixel error from the accurate position)
to the total measured particles (N m ). Moreover, the average value of position e xy is
defined in Eqs. (2.25) and (2.26):
e xy =
1
N c
N c
i=1
((x m (i) − x a ) 2 + (y m (i) − y a ) 2 ),
(2.25)
where “m” means the measured and “a” means the accurate results. A sharp decrease
in the percentage of detected particles with position errors e xy from 0.1 to 1 pixel is
shown in Fig. 2.34b. High reliabilities (near 95.6%) and small errors are also indicated
in Fig. 2.34c. In summary, the accuracy of the DTB method has been demonstrated
with high reliability and precision.
Furthermore, it is needed to pay attention to the phenomenon that a single particle
experiences an avalanche while its neighbor particles move very slowly or even stay
stationary. In this case, it is probable for the RM method to fail to detect the avalanche
motion which is probably regarded as the no-matching or partner loss. As mentioned
above, the Voronoï diagram is based on the pattern-based principle. In this approach,
a Voronoï polygon is constructed around each detected particle (Fig. 2.35). The union
of the different centers is the so-called Voronoï star. The Voronoï stars are tracked
instead of individual particles. Let F1 and F2 be two consecutive frames of the flow,
and P n,1 be the n
th particle in F1 and P m,2 the m
th particle in F2. The Voronoï star
related to each of the featured points P m,2 is compared with the one associated with
P n,1 by measuring the star distance, which is the degree of discrepancy between the
patterns comprising the two stars. The star distance is defined as the median of the
distances between the star extremities once the star centers P n,1 and P m,2 are made
to coincide [14].
In detail, the particle P a,1 in the first frame with the matching probability zero
will be linked to the particle P b,2 in the second frame which is not matched to the
Fig. 2.35 The Voronoï diagram and the Voronoï star representation for two successive frames (left
and middle insets), and the overlap of the two successive frames and Voronoï star displacement
(right inset)