

2.5 Particle Velocimetry Measurements
93
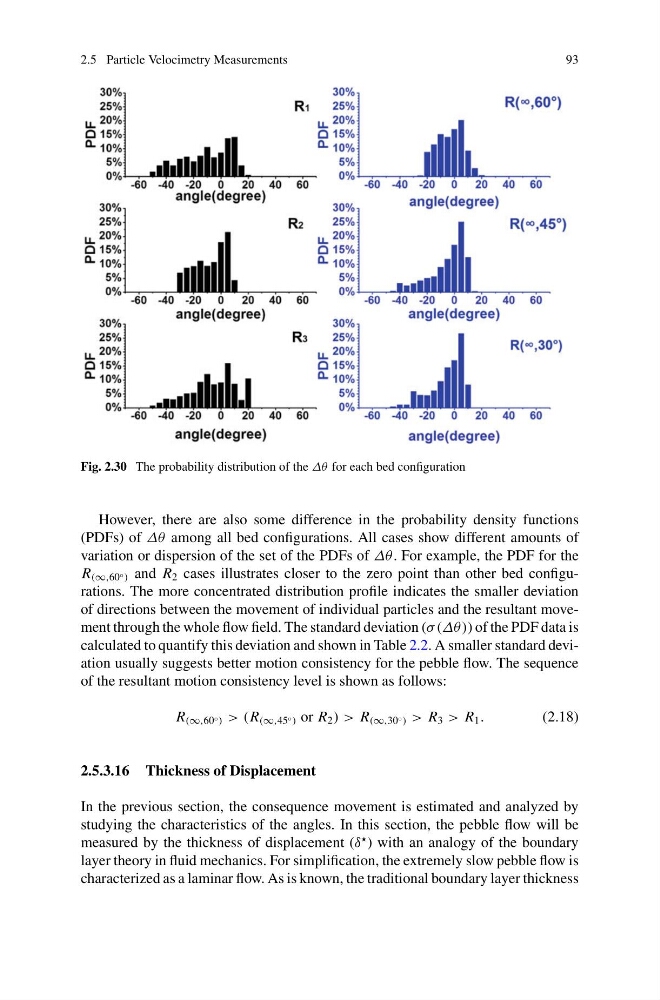
Fig. 2.30 The probability distribution of the Δθ for each bed configuration
However, there are also some difference in the probability density functions
(PDFs) of Δθ among all bed configurations. All cases show different amounts of
variation or dispersion of the set of the PDFs of Δθ . For example, the PDF for the
R (∞,60 ◦ ) and R 2 cases illustrates closer to the zero point than other bed configurations. The more concentrated distribution profile indicates the smaller deviation
of directions between the movement of individual particles and the resultant movement through the whole flow field. The standard deviation (σ (Δθ)) of the PDF data is
calculated to quantify this deviation and shown in Table 2.2. A smaller standard deviation usually suggests better motion consistency for the pebble flow. The sequence
of the resultant motion consistency level is shown as follows:
R (∞,60 ◦ ) > (R (∞,45 ◦ ) or R 2 ) > R (∞,30 ◦ ) > R 3 > R 1 .
(2.18)
2.5.3.16 Thickness of Displacement
In the previous section, the consequence movement is estimated and analyzed by
studying the characteristics of the angles. In this section, the pebble flow will be
measured by the thickness of displacement (δ
) with an analogy of the boundary
layer theory in fluid mechanics. For simplification, the extremely slow pebble flow is
characterized as a laminar flow. As is known, the traditional boundary layer thickness
93
Fig. 2.30 The probability distribution of the Δθ for each bed configuration
However, there are also some difference in the probability density functions
(PDFs) of Δθ among all bed configurations. All cases show different amounts of
variation or dispersion of the set of the PDFs of Δθ . For example, the PDF for the
R (∞,60 ◦ ) and R 2 cases illustrates closer to the zero point than other bed configurations. The more concentrated distribution profile indicates the smaller deviation
of directions between the movement of individual particles and the resultant movement through the whole flow field. The standard deviation (σ (Δθ)) of the PDF data is
calculated to quantify this deviation and shown in Table 2.2. A smaller standard deviation usually suggests better motion consistency for the pebble flow. The sequence
of the resultant motion consistency level is shown as follows:
R (∞,60 ◦ ) > (R (∞,45 ◦ ) or R 2 ) > R (∞,30 ◦ ) > R 3 > R 1 .
(2.18)
2.5.3.16 Thickness of Displacement
In the previous section, the consequence movement is estimated and analyzed by
studying the characteristics of the angles. In this section, the pebble flow will be
measured by the thickness of displacement (δ
) with an analogy of the boundary
layer theory in fluid mechanics. For simplification, the extremely slow pebble flow is
characterized as a laminar flow. As is known, the traditional boundary layer thickness