

2.5 Particle Velocimetry Measurements
89
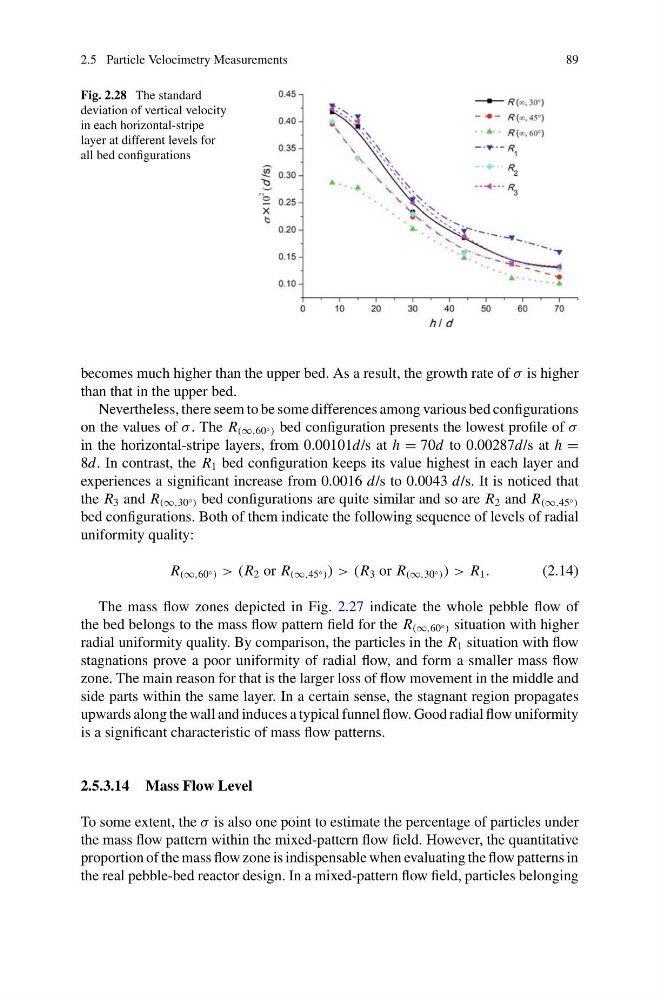
Fig. 2.28 The standard
deviation of vertical velocity
in each horizontal-stripe
layer at different levels for
all bed configurations
becomes much higher than the upper bed. As a result, the growth rate of σ is higher
than that in the upper bed.
Nevertheless, there seem to be some differences among various bed configurations
on the values of σ . The R (∞,60 ◦ ) bed configuration presents the lowest profile of σ
in the horizontal-stripe layers, from 0.00101d/s at h = 70d to 0.00287d/s at h =
8d. In contrast, the R 1 bed configuration keeps its value highest in each layer and
experiences a significant increase from 0.0016 d/s to 0.0043 d/s. It is noticed that
the R 3 and R (∞,30 ◦ ) bed configurations are quite similar and so are R 2 and R (∞,45 ◦ )
bed configurations. Both of them indicate the following sequence of levels of radial
uniformity quality:
R (∞,60 ◦ ) > (R 2 or R (∞,45 ◦ ) ) > (R 3 or R (∞,30 ◦ ) ) > R 1 .
(2.14)
The mass flow zones depicted in Fig. 2.27 indicate the whole pebble flow of
the bed belongs to the mass flow pattern field for the R (∞,60 ◦ ) situation with higher
radial uniformity quality. By comparison, the particles in the R 1 situation with flow
stagnations prove a poor uniformity of radial flow, and form a smaller mass flow
zone. The main reason for that is the larger loss of flow movement in the middle and
side parts within the same layer. In a certain sense, the stagnant region propagates
upwards along the wall and induces a typical funnel flow. Good radial flow uniformity
is a significant characteristic of mass flow patterns.
2.5.3.14 Mass Flow Level
To some extent, the σ is also one point to estimate the percentage of particles under
the mass flow pattern within the mixed-pattern flow field. However, the quantitative
proportion of the mass flow zone is indispensable when evaluating the flow patterns in
the real pebble-bed reactor design. In a mixed-pattern flow field, particles belonging
89
Fig. 2.28 The standard
deviation of vertical velocity
in each horizontal-stripe
layer at different levels for
all bed configurations
becomes much higher than the upper bed. As a result, the growth rate of σ is higher
than that in the upper bed.
Nevertheless, there seem to be some differences among various bed configurations
on the values of σ . The R (∞,60 ◦ ) bed configuration presents the lowest profile of σ
in the horizontal-stripe layers, from 0.00101d/s at h = 70d to 0.00287d/s at h =
8d. In contrast, the R 1 bed configuration keeps its value highest in each layer and
experiences a significant increase from 0.0016 d/s to 0.0043 d/s. It is noticed that
the R 3 and R (∞,30 ◦ ) bed configurations are quite similar and so are R 2 and R (∞,45 ◦ )
bed configurations. Both of them indicate the following sequence of levels of radial
uniformity quality:
R (∞,60 ◦ ) > (R 2 or R (∞,45 ◦ ) ) > (R 3 or R (∞,30 ◦ ) ) > R 1 .
(2.14)
The mass flow zones depicted in Fig. 2.27 indicate the whole pebble flow of
the bed belongs to the mass flow pattern field for the R (∞,60 ◦ ) situation with higher
radial uniformity quality. By comparison, the particles in the R 1 situation with flow
stagnations prove a poor uniformity of radial flow, and form a smaller mass flow
zone. The main reason for that is the larger loss of flow movement in the middle and
side parts within the same layer. In a certain sense, the stagnant region propagates
upwards along the wall and induces a typical funnel flow. Good radial flow uniformity
is a significant characteristic of mass flow patterns.
2.5.3.14 Mass Flow Level
To some extent, the σ is also one point to estimate the percentage of particles under
the mass flow pattern within the mixed-pattern flow field. However, the quantitative
proportion of the mass flow zone is indispensable when evaluating the flow patterns in
the real pebble-bed reactor design. In a mixed-pattern flow field, particles belonging