

254
10 Applications: Organic Interfaces
0
3000
3050
3100
3150
(A) Im [
]
(2)
Calc.
0
1
2
3
4
2800 2900 3000 3100 3200
(arb. unit)
Exp.
|
|
(2) 2
Frequency (cm )
-1
dipole
quadrupole
yyz
(B) SFG intensity
(arb. unit)
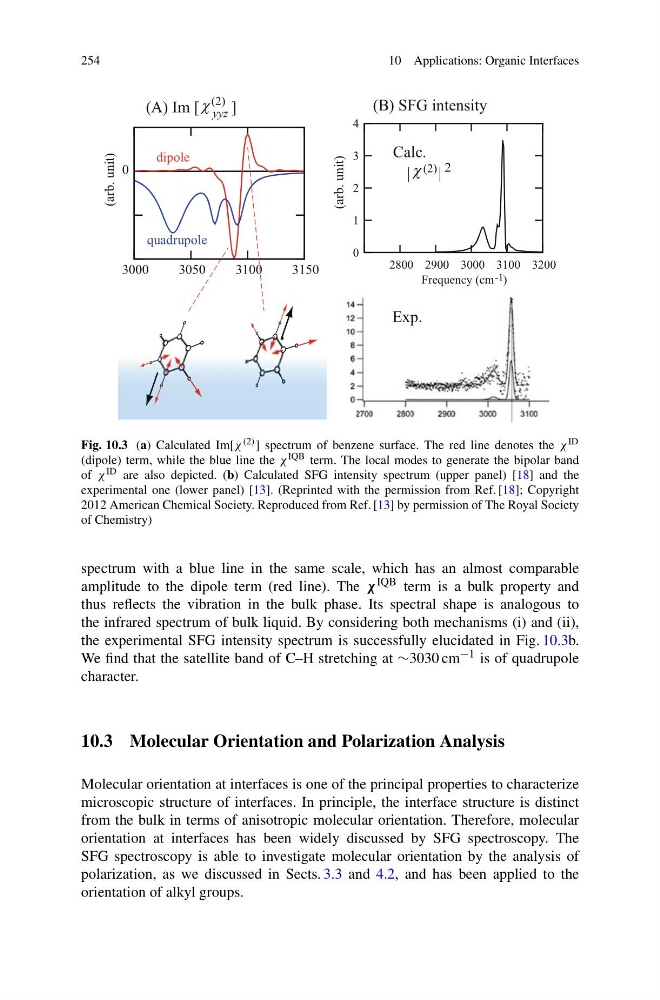
Fig. 10.3 (a) Calculated Im[χ (2) ] spectrum of benzene surface. The red line denotes the χ ID
(dipole) term, while the blue line the χ IQB term. The local modes to generate the bipolar band
of χ ID are also depicted. (b) Calculated SFG intensity spectrum (upper panel) [18] and the
experimental one (lower panel) [13]. (Reprinted with the permission from Ref. [18]; Copyright
2012 American Chemical Society. Reproduced from Ref. [13] by permission of The Royal Society
of Chemistry)
spectrum with a blue line in the same scale, which has an almost comparable
amplitude to the dipole term (red line). The χ IQB term is a bulk property and
thus reflects the vibration in the bulk phase. Its spectral shape is analogous to
the infrared spectrum of bulk liquid. By considering both mechanisms (i) and (ii),
the experimental SFG intensity spectrum is successfully elucidated in Fig. 10.3b.
We find that the satellite band of C–H stretching at ∼3030 cm −1 is of quadrupole
character.
10.3 Molecular Orientation and Polarization Analysis
Molecular orientation at interfaces is one of the principal properties to characterize
microscopic structure of interfaces. In principle, the interface structure is distinct
from the bulk in terms of anisotropic molecular orientation. Therefore, molecular
orientation at interfaces has been widely discussed by SFG spectroscopy. The
SFG spectroscopy is able to investigate molecular orientation by the analysis of
polarization, as we discussed in Sects. 3.3 and 4.2, and has been applied to the
orientation of alkyl groups.
10 Applications: Organic Interfaces
0
3000
3050
3100
3150
(A) Im [
]
(2)
Calc.
0
1
2
3
4
2800 2900 3000 3100 3200
(arb. unit)
Exp.
|
|
(2) 2
Frequency (cm )
-1
dipole
quadrupole
yyz
(B) SFG intensity
(arb. unit)
Fig. 10.3 (a) Calculated Im[χ (2) ] spectrum of benzene surface. The red line denotes the χ ID
(dipole) term, while the blue line the χ IQB term. The local modes to generate the bipolar band
of χ ID are also depicted. (b) Calculated SFG intensity spectrum (upper panel) [18] and the
experimental one (lower panel) [13]. (Reprinted with the permission from Ref. [18]; Copyright
2012 American Chemical Society. Reproduced from Ref. [13] by permission of The Royal Society
of Chemistry)
spectrum with a blue line in the same scale, which has an almost comparable
amplitude to the dipole term (red line). The χ IQB term is a bulk property and
thus reflects the vibration in the bulk phase. Its spectral shape is analogous to
the infrared spectrum of bulk liquid. By considering both mechanisms (i) and (ii),
the experimental SFG intensity spectrum is successfully elucidated in Fig. 10.3b.
We find that the satellite band of C–H stretching at ∼3030 cm −1 is of quadrupole
character.
10.3 Molecular Orientation and Polarization Analysis
Molecular orientation at interfaces is one of the principal properties to characterize
microscopic structure of interfaces. In principle, the interface structure is distinct
from the bulk in terms of anisotropic molecular orientation. Therefore, molecular
orientation at interfaces has been widely discussed by SFG spectroscopy. The
SFG spectroscopy is able to investigate molecular orientation by the analysis of
polarization, as we discussed in Sects. 3.3 and 4.2, and has been applied to the
orientation of alkyl groups.