

10.1 C–H Bands of Alkyl Groups
251
2800
3000
0
2700
2800
2900
3000
3100
0
(arb. unit)
2
3
2, 9
5
-1
(C) Im [
]
(arb. unit)
2600
2800
3000
3200
-1
0
1
(2)
yyz
EPSA (r shifted)
(A) SFG intensity
low-freq
high-freq
asym. stretch
(
)
sym. stretch
( )
( r )
+
( r )
+
FR
( r )
( r )
+
( r )
( r )
+
FR
Original
(B) Energy levels
Frequency (cm )
3
2, 9
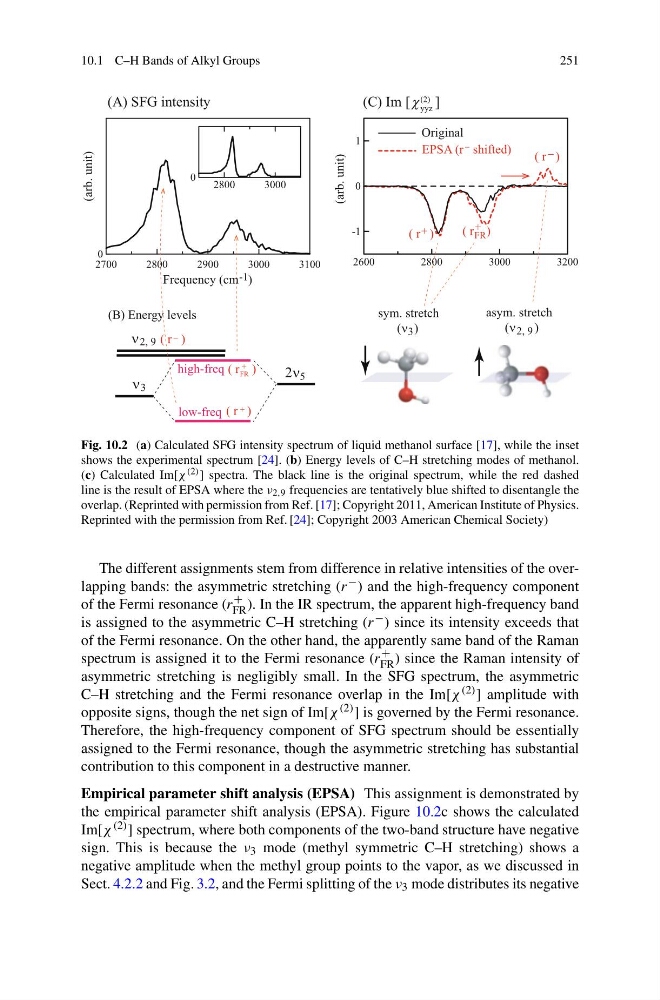
Fig. 10.2 (a) Calculated SFG intensity spectrum of liquid methanol surface [17], while the inset
shows the experimental spectrum [24]. (b) Energy levels of C–H stretching modes of methanol.
(c) Calculated Im[χ (2) ] spectra. The black line is the original spectrum, while the red dashed
line is the result of EPSA where the ν 2,9 frequencies are tentatively blue shifted to disentangle the
overlap. (Reprinted with permission from Ref. [17]; Copyright 2011, American Institute of Physics.
Reprinted with the permission from Ref. [24]; Copyright 2003 American Chemical Society)
The different assignments stem from difference in relative intensities of the overlapping bands: the asymmetric stretching (r − ) and the high-frequency component
of the Fermi resonance (r
+
FR ). In the IR spectrum, the apparent high-frequency band
is assigned to the asymmetric C–H stretching (r − ) since its intensity exceeds that
of the Fermi resonance. On the other hand, the apparently same band of the Raman
spectrum is assigned it to the Fermi resonance (r
+
FR ) since the Raman intensity of
asymmetric stretching is negligibly small. In the SFG spectrum, the asymmetric
C–H stretching and the Fermi resonance overlap in the Im[χ (2) ] amplitude with
opposite signs, though the net sign of Im[χ (2) ] is governed by the Fermi resonance.
Therefore, the high-frequency component of SFG spectrum should be essentially
assigned to the Fermi resonance, though the asymmetric stretching has substantial
contribution to this component in a destructive manner.
Empirical parameter shift analysis (EPSA) This assignment is demonstrated by
the empirical parameter shift analysis (EPSA). Figure 10.2c shows the calculated
Im[χ (2) ] spectrum, where both components of the two-band structure have negative
sign. This is because the ν 3 mode (methyl symmetric C–H stretching) shows a
negative amplitude when the methyl group points to the vapor, as we discussed in
Sect. 4.2.2 and Fig. 3.2, and the Fermi splitting of the ν 3 mode distributes its negative
251
2800
3000
0
2700
2800
2900
3000
3100
0
(arb. unit)
2
3
2, 9
5
-1
(C) Im [
]
(arb. unit)
2600
2800
3000
3200
-1
0
1
(2)
yyz
EPSA (r shifted)
(A) SFG intensity
low-freq
high-freq
asym. stretch
(
)
sym. stretch
( )
( r )
+
( r )
+
FR
( r )
( r )
+
( r )
( r )
+
FR
Original
(B) Energy levels
Frequency (cm )
3
2, 9
Fig. 10.2 (a) Calculated SFG intensity spectrum of liquid methanol surface [17], while the inset
shows the experimental spectrum [24]. (b) Energy levels of C–H stretching modes of methanol.
(c) Calculated Im[χ (2) ] spectra. The black line is the original spectrum, while the red dashed
line is the result of EPSA where the ν 2,9 frequencies are tentatively blue shifted to disentangle the
overlap. (Reprinted with permission from Ref. [17]; Copyright 2011, American Institute of Physics.
Reprinted with the permission from Ref. [24]; Copyright 2003 American Chemical Society)
The different assignments stem from difference in relative intensities of the overlapping bands: the asymmetric stretching (r − ) and the high-frequency component
of the Fermi resonance (r
+
FR ). In the IR spectrum, the apparent high-frequency band
is assigned to the asymmetric C–H stretching (r − ) since its intensity exceeds that
of the Fermi resonance. On the other hand, the apparently same band of the Raman
spectrum is assigned it to the Fermi resonance (r
+
FR ) since the Raman intensity of
asymmetric stretching is negligibly small. In the SFG spectrum, the asymmetric
C–H stretching and the Fermi resonance overlap in the Im[χ (2) ] amplitude with
opposite signs, though the net sign of Im[χ (2) ] is governed by the Fermi resonance.
Therefore, the high-frequency component of SFG spectrum should be essentially
assigned to the Fermi resonance, though the asymmetric stretching has substantial
contribution to this component in a destructive manner.
Empirical parameter shift analysis (EPSA) This assignment is demonstrated by
the empirical parameter shift analysis (EPSA). Figure 10.2c shows the calculated
Im[χ (2) ] spectrum, where both components of the two-band structure have negative
sign. This is because the ν 3 mode (methyl symmetric C–H stretching) shows a
negative amplitude when the methyl group points to the vapor, as we discussed in
Sect. 4.2.2 and Fig. 3.2, and the Fermi splitting of the ν 3 mode distributes its negative