

9.3 Electrolyte Solution Surfaces
233
3000
3200
3400
3600
3800
3000 3400 3800
< cos >
-10
10
-0.2
-0.1
0
0.1
0.2
O O O O
H
H H
O O
Frequency [cm ]
-1
0
z [Å]
^
(A) SFG
(B) Water Orientation
θ
pure water
HCl
HI
θ
Intensity (arb. unit)
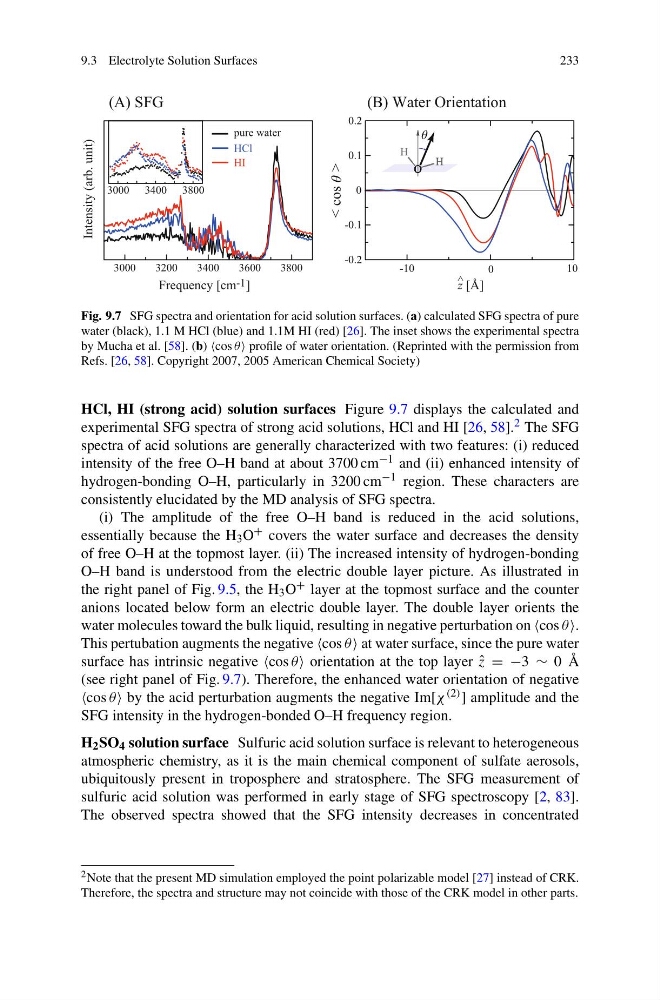
Fig. 9.7 SFG spectra and orientation for acid solution surfaces. (a) calculated SFG spectra of pure
water (black), 1.1 M HCl (blue) and 1.1M HI (red) [26]. The inset shows the experimental spectra
by Mucha et al. [58]. (b) cos θ profile of water orientation. (Reprinted with the permission from
Refs. [26, 58]. Copyright 2007, 2005 American Chemical Society)
HCl, HI (strong acid) solution surfaces Figure 9.7 displays the calculated and
experimental SFG spectra of strong acid solutions, HCl and HI [26, 58]. 2 The SFG
spectra of acid solutions are generally characterized with two features: (i) reduced
intensity of the free O–H band at about 3700 cm −1 and (ii) enhanced intensity of
hydrogen-bonding O–H, particularly in 3200 cm −1 region. These characters are
consistently elucidated by the MD analysis of SFG spectra.
(i) The amplitude of the free O–H band is reduced in the acid solutions,
essentially because the H 3 O + covers the water surface and decreases the density
of free O–H at the topmost layer. (ii) The increased intensity of hydrogen-bonding
O–H band is understood from the electric double layer picture. As illustrated in
the right panel of Fig. 9.5, the H 3 O + layer at the topmost surface and the counter
anions located below form an electric double layer. The double layer orients the
water molecules toward the bulk liquid, resulting in negative perturbation on cos θ .
This pertubation augments the negative cos θ at water surface, since the pure water
surface has intrinsic negative cos θ orientation at the top layer ˆ
z = −3 ∼ 0 Å
(see right panel of Fig. 9.7). Therefore, the enhanced water orientation of negative
cos θ by the acid perturbation augments the negative Im[χ (2) ] amplitude and the
SFG intensity in the hydrogen-bonded O–H frequency region.
H 2 SO 4 solution surface Sulfuric acid solution surface is relevant to heterogeneous
atmospheric chemistry, as it is the main chemical component of sulfate aerosols,
ubiquitously present in troposphere and stratosphere. The SFG measurement of
sulfuric acid solution was performed in early stage of SFG spectroscopy [2, 83].
The observed spectra showed that the SFG intensity decreases in concentrated
2 Note that the present MD simulation employed the point polarizable model [27] instead of CRK.
Therefore, the spectra and structure may not coincide with those of the CRK model in other parts.
233
3000
3200
3400
3600
3800
3000 3400 3800
< cos >
-10
10
-0.2
-0.1
0
0.1
0.2
O O O O
H
H H
O O
Frequency [cm ]
-1
0
z [Å]
^
(A) SFG
(B) Water Orientation
θ
pure water
HCl
HI
θ
Intensity (arb. unit)
Fig. 9.7 SFG spectra and orientation for acid solution surfaces. (a) calculated SFG spectra of pure
water (black), 1.1 M HCl (blue) and 1.1M HI (red) [26]. The inset shows the experimental spectra
by Mucha et al. [58]. (b) cos θ profile of water orientation. (Reprinted with the permission from
Refs. [26, 58]. Copyright 2007, 2005 American Chemical Society)
HCl, HI (strong acid) solution surfaces Figure 9.7 displays the calculated and
experimental SFG spectra of strong acid solutions, HCl and HI [26, 58]. 2 The SFG
spectra of acid solutions are generally characterized with two features: (i) reduced
intensity of the free O–H band at about 3700 cm −1 and (ii) enhanced intensity of
hydrogen-bonding O–H, particularly in 3200 cm −1 region. These characters are
consistently elucidated by the MD analysis of SFG spectra.
(i) The amplitude of the free O–H band is reduced in the acid solutions,
essentially because the H 3 O + covers the water surface and decreases the density
of free O–H at the topmost layer. (ii) The increased intensity of hydrogen-bonding
O–H band is understood from the electric double layer picture. As illustrated in
the right panel of Fig. 9.5, the H 3 O + layer at the topmost surface and the counter
anions located below form an electric double layer. The double layer orients the
water molecules toward the bulk liquid, resulting in negative perturbation on cos θ .
This pertubation augments the negative cos θ at water surface, since the pure water
surface has intrinsic negative cos θ orientation at the top layer ˆ
z = −3 ∼ 0 Å
(see right panel of Fig. 9.7). Therefore, the enhanced water orientation of negative
cos θ by the acid perturbation augments the negative Im[χ (2) ] amplitude and the
SFG intensity in the hydrogen-bonded O–H frequency region.
H 2 SO 4 solution surface Sulfuric acid solution surface is relevant to heterogeneous
atmospheric chemistry, as it is the main chemical component of sulfate aerosols,
ubiquitously present in troposphere and stratosphere. The SFG measurement of
sulfuric acid solution was performed in early stage of SFG spectroscopy [2, 83].
The observed spectra showed that the SFG intensity decreases in concentrated
2 Note that the present MD simulation employed the point polarizable model [27] instead of CRK.
Therefore, the spectra and structure may not coincide with those of the CRK model in other parts.