

9.3 Electrolyte Solution Surfaces
231
0
3000 3200 3400 3600 3800
SFG Intensity [arb. unit]
Frequency [cm -1 ]
0
(MD)
pure water
NaF
(Exp.)
0
3000 3200 3400 3600 3800
Frequency [cm -1 ]
0
(MD)
pure water
Na 2 SO 4
(Exp.)
−15
−10
−5
0
5
10
0
0.5
1
1.5
z [Å]
(z) / bulk
H 2 O
Na
+
F
−
−15
−10
−5
0
5
10
0
0.5
1
1.5
(z) / bulk
H 2 O
Na
+
SO 4
2−
−15
−10
−5
0
5
10
−0.1
0
0.1
< cos >
pure water
Na 2 SO 4
NaF
(A) SFG
(B) Density profiles
(C) Water orientation
NaF
NaF
Na SO
2
4
Na SO
2
4
^
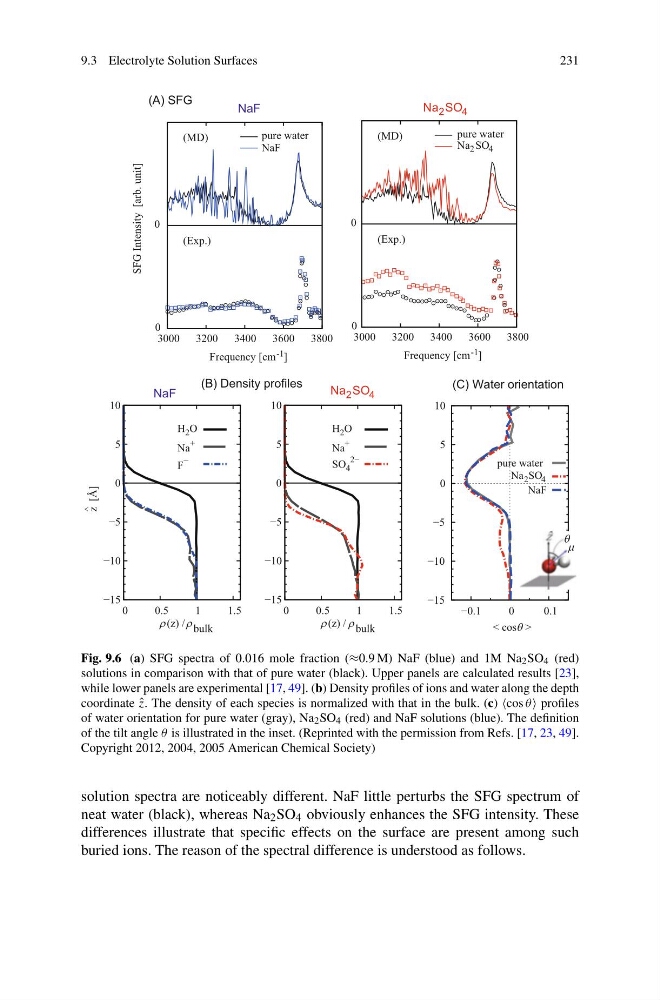
Fig. 9.6 (a) SFG spectra of 0.016 mole fraction (≈0.9 M) NaF (blue) and 1M Na 2 SO 4 (red)
solutions in comparison with that of pure water (black). Upper panels are calculated results [23],
while lower panels are experimental [17, 49]. (b) Density profiles of ions and water along the depth
coordinate ˆ
z. The density of each species is normalized with that in the bulk. (c) cos θ profiles
of water orientation for pure water (gray), Na 2 SO 4 (red) and NaF solutions (blue). The definition
of the tilt angle θ is illustrated in the inset. (Reprinted with the permission from Refs. [17, 23, 49].
Copyright 2012, 2004, 2005 American Chemical Society)
solution spectra are noticeably different. NaF little perturbs the SFG spectrum of
neat water (black), whereas Na 2 SO 4 obviously enhances the SFG intensity. These
differences illustrate that specific effects on the surface are present among such
buried ions. The reason of the spectral difference is understood as follows.
231
0
3000 3200 3400 3600 3800
SFG Intensity [arb. unit]
Frequency [cm -1 ]
0
(MD)
pure water
NaF
(Exp.)
0
3000 3200 3400 3600 3800
Frequency [cm -1 ]
0
(MD)
pure water
Na 2 SO 4
(Exp.)
−15
−10
−5
0
5
10
0
0.5
1
1.5
z [Å]
(z) / bulk
H 2 O
Na
+
F
−
−15
−10
−5
0
5
10
0
0.5
1
1.5
(z) / bulk
H 2 O
Na
+
SO 4
2−
−15
−10
−5
0
5
10
−0.1
0
0.1
< cos >
pure water
Na 2 SO 4
NaF
(A) SFG
(B) Density profiles
(C) Water orientation
NaF
NaF
Na SO
2
4
Na SO
2
4
^
Fig. 9.6 (a) SFG spectra of 0.016 mole fraction (≈0.9 M) NaF (blue) and 1M Na 2 SO 4 (red)
solutions in comparison with that of pure water (black). Upper panels are calculated results [23],
while lower panels are experimental [17, 49]. (b) Density profiles of ions and water along the depth
coordinate ˆ
z. The density of each species is normalized with that in the bulk. (c) cos θ profiles
of water orientation for pure water (gray), Na 2 SO 4 (red) and NaF solutions (blue). The definition
of the tilt angle θ is illustrated in the inset. (Reprinted with the permission from Refs. [17, 23, 49].
Copyright 2012, 2004, 2005 American Chemical Society)
solution spectra are noticeably different. NaF little perturbs the SFG spectrum of
neat water (black), whereas Na 2 SO 4 obviously enhances the SFG intensity. These
differences illustrate that specific effects on the surface are present among such
buried ions. The reason of the spectral difference is understood as follows.