

9.1 Water Surface
221
Sect. 4.2, the sign of the Im[χ (2) ] spectrum in the SSP polarization is indicative
of the orientation of the transition dipole for the O–H stretching vibration. The
positive sign at 3700 cm −1 indicates upward O–H orientation with H pointing
to the vapor, while the negative sign at 3000∼3600 cm −1 implies downward
O–H orientation. Subsequently the phase-sensitive or heterodyne-detected SFG
measurement confirmed the band shape of the Im[χ (2) ] spectrum [40, 66, 105]. 1
The prediction of the Im[χ (2) ] spectral features is the first successful demonstration
of the computational analysis in the SFG spectroscopy.
Thickness of surface sensitivity One important and general concern in the SFG
spectroscopy is to find the depth of detection in the interface region. As we have
argued in Chap. 1, the SFG is sensitive to the interface where the inversion symmetry
is broken. The SFG-active region of interface may depend on the system in question.
In molecular liquids such as water, the broken symmetry arises from anisotropic
molecular orientation near the interface, whereas the bulk material has random and
isotropic orientation. The MD simulation is able to investigate molecular orientation
with varying depth, and thereby answer the question about the spatial origin of
surface sensitivity.
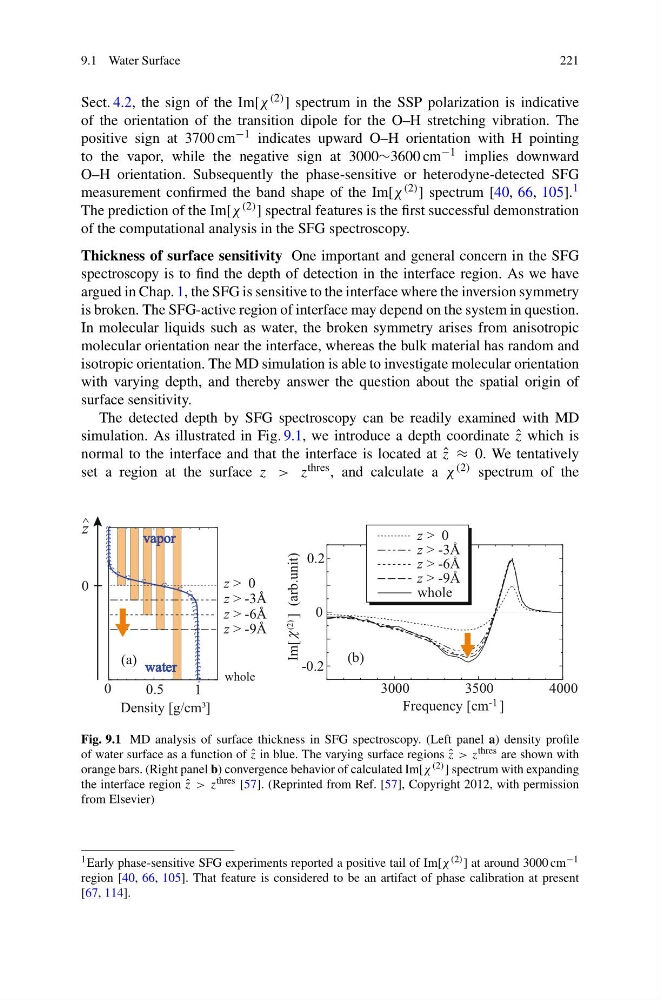
The detected depth by SFG spectroscopy can be readily examined with MD
simulation. As illustrated in Fig. 9.1, we introduce a depth coordinate ˆ
z which is
normal to the interface and that the interface is located at ˆ
z ≈ 0. We tentatively
set a region at the surface z > z thres , and calculate a χ (2) spectrum of the
3000
3500
4000
-0.2
0
0.2
z > 0
z > -3Å
z > -6Å
z > -9Å
whole
(b)
Frequency [cm ]
Im[
(2)
] (arb.unit)
0
0.5
1
-1
z > 0
z > -3Å
z > -6Å
z > -9Å
whole
(a)
z ^
0
vapor vapor
water water
Fig. 9.1 MD analysis of surface thickness in SFG spectroscopy. (Left panel a) density profile
of water surface as a function of ˆ
z in blue. The varying surface regions ˆ
z > z thres are shown with
orange bars. (Right panel b) convergence behavior of calculated Im[χ (2) ] spectrum with expanding
the interface region ˆ
z > z thres [57]. (Reprinted from Ref. [57], Copyright 2012, with permission
from Elsevier)
1 Early phase-sensitive SFG experiments reported a positive tail of Im[χ (2) ] at around 3000 cm −1
region [40, 66, 105]. That feature is considered to be an artifact of phase calibration at present
[67, 114].
221
Sect. 4.2, the sign of the Im[χ (2) ] spectrum in the SSP polarization is indicative
of the orientation of the transition dipole for the O–H stretching vibration. The
positive sign at 3700 cm −1 indicates upward O–H orientation with H pointing
to the vapor, while the negative sign at 3000∼3600 cm −1 implies downward
O–H orientation. Subsequently the phase-sensitive or heterodyne-detected SFG
measurement confirmed the band shape of the Im[χ (2) ] spectrum [40, 66, 105]. 1
The prediction of the Im[χ (2) ] spectral features is the first successful demonstration
of the computational analysis in the SFG spectroscopy.
Thickness of surface sensitivity One important and general concern in the SFG
spectroscopy is to find the depth of detection in the interface region. As we have
argued in Chap. 1, the SFG is sensitive to the interface where the inversion symmetry
is broken. The SFG-active region of interface may depend on the system in question.
In molecular liquids such as water, the broken symmetry arises from anisotropic
molecular orientation near the interface, whereas the bulk material has random and
isotropic orientation. The MD simulation is able to investigate molecular orientation
with varying depth, and thereby answer the question about the spatial origin of
surface sensitivity.
The detected depth by SFG spectroscopy can be readily examined with MD
simulation. As illustrated in Fig. 9.1, we introduce a depth coordinate ˆ
z which is
normal to the interface and that the interface is located at ˆ
z ≈ 0. We tentatively
set a region at the surface z > z thres , and calculate a χ (2) spectrum of the
3000
3500
4000
-0.2
0
0.2
z > 0
z > -3Å
z > -6Å
z > -9Å
whole
(b)
Frequency [cm ]
Im[
(2)
] (arb.unit)
0
0.5
1
-1
z > 0
z > -3Å
z > -6Å
z > -9Å
whole
(a)
z ^
0
vapor vapor
water water
Fig. 9.1 MD analysis of surface thickness in SFG spectroscopy. (Left panel a) density profile
of water surface as a function of ˆ
z in blue. The varying surface regions ˆ
z > z thres are shown with
orange bars. (Right panel b) convergence behavior of calculated Im[χ (2) ] spectrum with expanding
the interface region ˆ
z > z thres [57]. (Reprinted from Ref. [57], Copyright 2012, with permission
from Elsevier)
1 Early phase-sensitive SFG experiments reported a positive tail of Im[χ (2) ] at around 3000 cm −1
region [40, 66, 105]. That feature is considered to be an artifact of phase calibration at present
[67, 114].