

6
1 Introduction
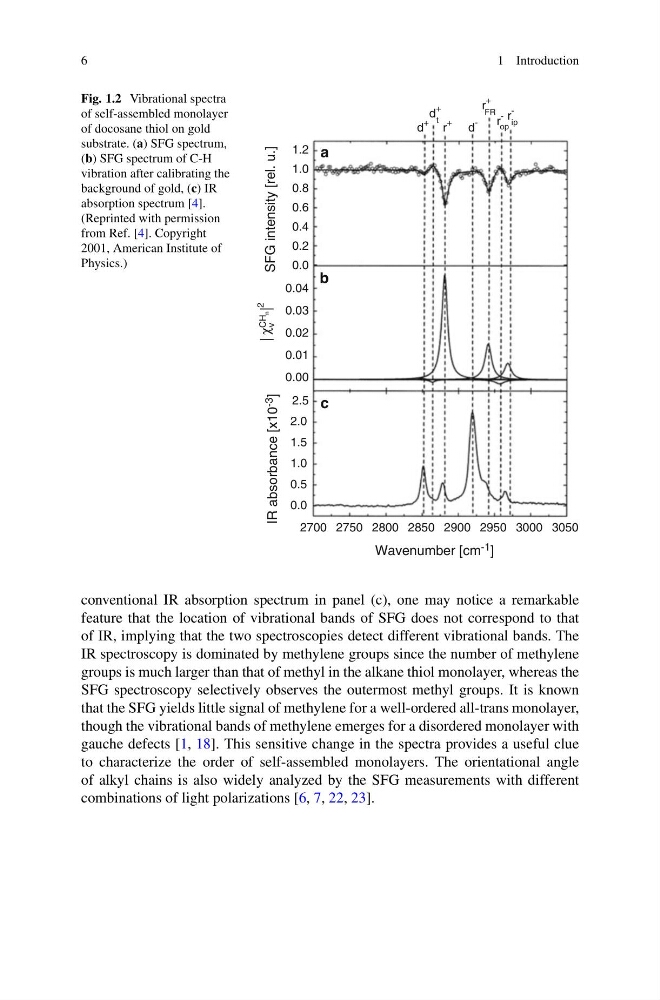
Fig. 1.2 Vibrational spectra
of self-assembled monolayer
of docosane thiol on gold
substrate. (a) SFG spectrum,
(b) SFG spectrum of C-H
vibration after calibrating the
background of gold, (c) IR
absorption spectrum [4].
(Reprinted with permission
from Ref. [4]. Copyright
2001, American Institute of
Physics.)
1.2 a
b
c
d
+
d
-
r
+
r
+
FR
r
-
op
r
-
ip
t
d
+
1.0
0.8
0.6
0.4
0.2
0.0
0.04
0.03
0.02
0.01
0.00
2.5
2.0
1.5
1.0
0.5
0.0
2700 2750 2800 2850
Wavenumber [cm -1 ]
IR absorbance [x10 -3
]
SFG intensity [rel. u.]
CH
n
| χ
v
|
2
2900 2950 3000 3050
conventional IR absorption spectrum in panel (c), one may notice a remarkable
feature that the location of vibrational bands of SFG does not correspond to that
of IR, implying that the two spectroscopies detect different vibrational bands. The
IR spectroscopy is dominated by methylene groups since the number of methylene
groups is much larger than that of methyl in the alkane thiol monolayer, whereas the
SFG spectroscopy selectively observes the outermost methyl groups. It is known
that the SFG yields little signal of methylene for a well-ordered all-trans monolayer,
though the vibrational bands of methylene emerges for a disordered monolayer with
gauche defects [1, 18]. This sensitive change in the spectra provides a useful clue
to characterize the order of self-assembled monolayers. The orientational angle
of alkyl chains is also widely analyzed by the SFG measurements with different
combinations of light polarizations [6, 7, 22, 23].
1 Introduction
Fig. 1.2 Vibrational spectra
of self-assembled monolayer
of docosane thiol on gold
substrate. (a) SFG spectrum,
(b) SFG spectrum of C-H
vibration after calibrating the
background of gold, (c) IR
absorption spectrum [4].
(Reprinted with permission
from Ref. [4]. Copyright
2001, American Institute of
Physics.)
1.2 a
b
c
d
+
d
-
r
+
r
+
FR
r
-
op
r
-
ip
t
d
+
1.0
0.8
0.6
0.4
0.2
0.0
0.04
0.03
0.02
0.01
0.00
2.5
2.0
1.5
1.0
0.5
0.0
2700 2750 2800 2850
Wavenumber [cm -1 ]
IR absorbance [x10 -3
]
SFG intensity [rel. u.]
CH
n
| χ
v
|
2
2900 2950 3000 3050
conventional IR absorption spectrum in panel (c), one may notice a remarkable
feature that the location of vibrational bands of SFG does not correspond to that
of IR, implying that the two spectroscopies detect different vibrational bands. The
IR spectroscopy is dominated by methylene groups since the number of methylene
groups is much larger than that of methyl in the alkane thiol monolayer, whereas the
SFG spectroscopy selectively observes the outermost methyl groups. It is known
that the SFG yields little signal of methylene for a well-ordered all-trans monolayer,
though the vibrational bands of methylene emerges for a disordered monolayer with
gauche defects [1, 18]. This sensitive change in the spectra provides a useful clue
to characterize the order of self-assembled monolayers. The orientational angle
of alkyl chains is also widely analyzed by the SFG measurements with different
combinations of light polarizations [6, 7, 22, 23].