

K. Chruszcz-Lipska and E. W. Blanch
66
spectral range that are characteristic for the appropriate features of carbohydrate
architecture. As was proposed in the literature [27, 28] the whole spectral range in
the RoA spectra of monosaccharides can be divided into the regions that contain
specific information about their stereochemistry: low frequency (250–600 cm
−1
),
anomeric (600–950 cm
−1
), fingerprint (950–1200 cm
−1
) and Ch 2 and C–o–h deformations (1200–1500 cm
−1
). thanks to laborious analysis and detailed comparison
of RoA spectra of monosaccharides from the same homomorphic series, including selected similar structures and isotopomers, it is possible to obtain information
about conformation of the ring, the disposition of hydroxyl groups in the ring, the
absolute configuration and vertical or horizontal orientation of groups bounded to
the anomeric carbon, and as well the conformation of the exocyclic –Ch 2 oh group
[27–29]. on the other hand, more complex compounds like di-, tri- [30–33], oligo-[34] or polysaccharides [35, 36] were successfully studied by RoA spectroscopy
and gave additional information on glycosidic linkage types and its conformation
and also secondary or even tertiary structure.
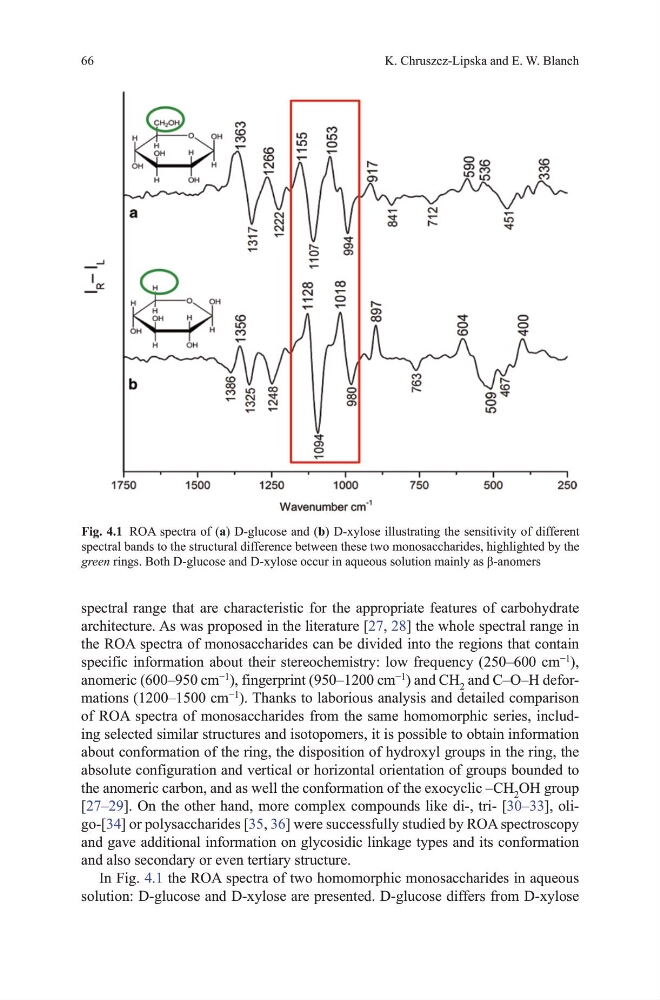
In Fig. 4.1 the RoA spectra of two homomorphic monosaccharides in aqueous
solution: d-glucose and d-xylose are presented. d-glucose differs from d-xylose
Fig. 4.1 RoA spectra of (a) d-glucose and (b) d-xylose illustrating the sensitivity of different
spectral bands to the structural difference between these two monosaccharides, highlighted by the
green rings. Both D-glucose and D-xylose occur in aqueous solution mainly as β-anomers
66
spectral range that are characteristic for the appropriate features of carbohydrate
architecture. As was proposed in the literature [27, 28] the whole spectral range in
the RoA spectra of monosaccharides can be divided into the regions that contain
specific information about their stereochemistry: low frequency (250–600 cm
−1
),
anomeric (600–950 cm
−1
), fingerprint (950–1200 cm
−1
) and Ch 2 and C–o–h deformations (1200–1500 cm
−1
). thanks to laborious analysis and detailed comparison
of RoA spectra of monosaccharides from the same homomorphic series, including selected similar structures and isotopomers, it is possible to obtain information
about conformation of the ring, the disposition of hydroxyl groups in the ring, the
absolute configuration and vertical or horizontal orientation of groups bounded to
the anomeric carbon, and as well the conformation of the exocyclic –Ch 2 oh group
[27–29]. on the other hand, more complex compounds like di-, tri- [30–33], oligo-[34] or polysaccharides [35, 36] were successfully studied by RoA spectroscopy
and gave additional information on glycosidic linkage types and its conformation
and also secondary or even tertiary structure.
In Fig. 4.1 the RoA spectra of two homomorphic monosaccharides in aqueous
solution: d-glucose and d-xylose are presented. d-glucose differs from d-xylose
Fig. 4.1 RoA spectra of (a) d-glucose and (b) d-xylose illustrating the sensitivity of different
spectral bands to the structural difference between these two monosaccharides, highlighted by the
green rings. Both D-glucose and D-xylose occur in aqueous solution mainly as β-anomers