

T.P. Wróbel et al.
526
the Ch 2 /Ch 3 vibration band at 2800–3025 cm
−1
is present for both proteins and
lipids and therefore was not used for any discrimination, however, the shape of the
band is quite different for lipidic long chains than for average protein present in the
tissue. moreover, in this region the fatty chain unsaturation level can be determined
[64] by a feature at 3008 cm
−1
. It was suggested [67] that for cholesteryl esters with
an increase in the number of double bonds in the fatty acid moiety the band shifts
from 3003 to 3009 cm
−1
for cholesteryl oleate and cholesteryl linoleate, respectively.
Pure cholesterol was identified as having a quite specific (with respect to other
lipids in the tissue) band at 1055 cm
−1
. unfortunately, this band is present in a
region rich in vibrations (1000–1100 cm
−1
) of many constituents, including sugar moieties and Po
2−
containing compounds. however, inside the atherosclerotic
plaque cholesterol predominates in concentration and this band can be successfully
used to indicate cholesterol presence.
Calcification is more pronounced in Raman spectra but still in Ft-IR it is possible to find corresponding, yet quite broad bands [57, 60], i.e. ~ 3400, ~ 1000–1080
and ~ 600 cm
−1
. these spectral regions are common to many compounds that are
present in the tissue (as mentioned earlier) and therefore Ft-IR analysis of calcification is of limited applicability and interest. however, if Ft-IR is used not as a standalone technique but is correlated with, e.g. nanoindentation, it can give interesting
results [66]. using band’s integrations of 3 main components (lipids, protein matrix
and mineral content) vs. modulus from AtR measurements, Ebenstein et al. [66]
showed that mineral:matrix ratio correlates well with increasing modulus, which
is not surprising, however they’ve also found an indication that Lipid:matrix ratio
may also correlate.
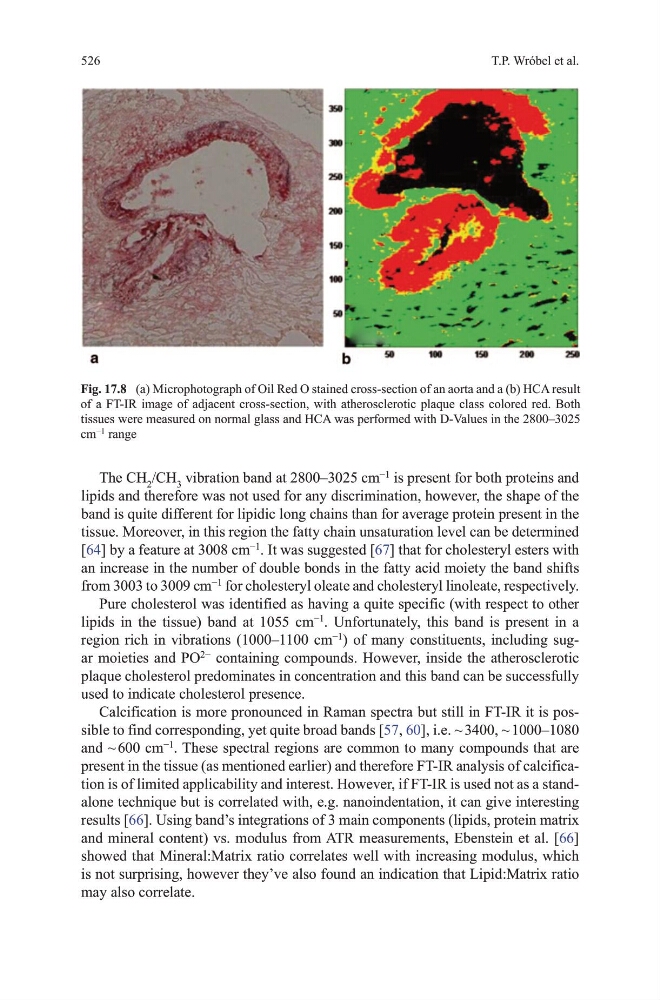
Fig. 17.8 (a) microphotograph of oil Red o stained cross-section of an aorta and a (b) hCA result
of a Ft-IR image of adjacent cross-section, with atherosclerotic plaque class colored red. Both
tissues were measured on normal glass and hCA was performed with d-values in the 2800–3025
cm
−1
range
526
the Ch 2 /Ch 3 vibration band at 2800–3025 cm
−1
is present for both proteins and
lipids and therefore was not used for any discrimination, however, the shape of the
band is quite different for lipidic long chains than for average protein present in the
tissue. moreover, in this region the fatty chain unsaturation level can be determined
[64] by a feature at 3008 cm
−1
. It was suggested [67] that for cholesteryl esters with
an increase in the number of double bonds in the fatty acid moiety the band shifts
from 3003 to 3009 cm
−1
for cholesteryl oleate and cholesteryl linoleate, respectively.
Pure cholesterol was identified as having a quite specific (with respect to other
lipids in the tissue) band at 1055 cm
−1
. unfortunately, this band is present in a
region rich in vibrations (1000–1100 cm
−1
) of many constituents, including sugar moieties and Po
2−
containing compounds. however, inside the atherosclerotic
plaque cholesterol predominates in concentration and this band can be successfully
used to indicate cholesterol presence.
Calcification is more pronounced in Raman spectra but still in Ft-IR it is possible to find corresponding, yet quite broad bands [57, 60], i.e. ~ 3400, ~ 1000–1080
and ~ 600 cm
−1
. these spectral regions are common to many compounds that are
present in the tissue (as mentioned earlier) and therefore Ft-IR analysis of calcification is of limited applicability and interest. however, if Ft-IR is used not as a standalone technique but is correlated with, e.g. nanoindentation, it can give interesting
results [66]. using band’s integrations of 3 main components (lipids, protein matrix
and mineral content) vs. modulus from AtR measurements, Ebenstein et al. [66]
showed that mineral:matrix ratio correlates well with increasing modulus, which
is not surprising, however they’ve also found an indication that Lipid:matrix ratio
may also correlate.
Fig. 17.8 (a) microphotograph of oil Red o stained cross-section of an aorta and a (b) hCA result
of a Ft-IR image of adjacent cross-section, with atherosclerotic plaque class colored red. Both
tissues were measured on normal glass and hCA was performed with d-values in the 2800–3025
cm
−1
range