

T.P. Wróbel et al.
522
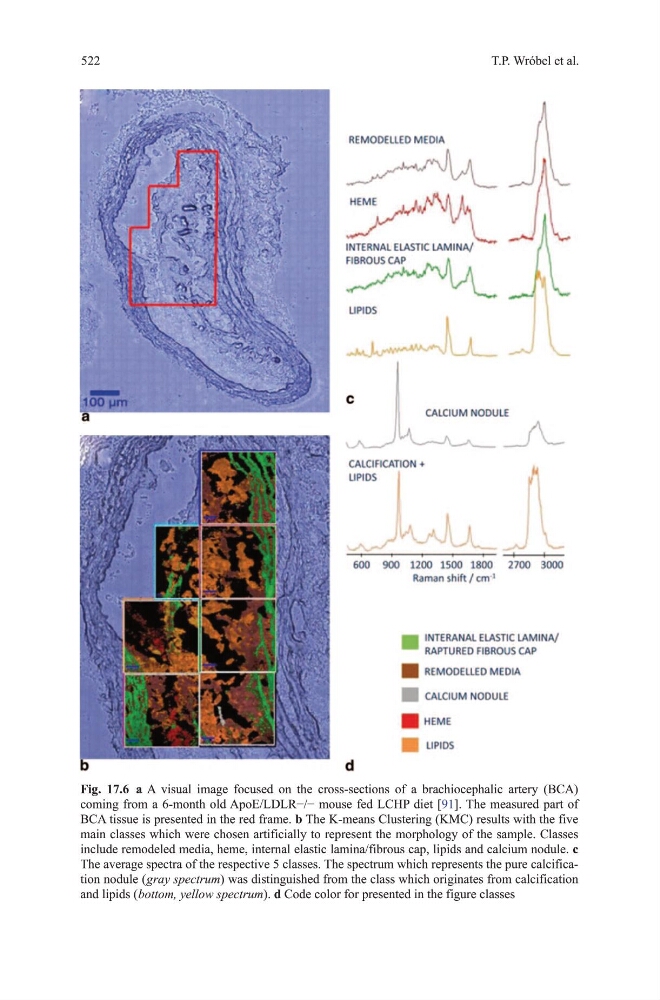
Fig. 17.6 a A visual image focused on the cross-sections of a brachiocephalic artery (BCA)
coming from a 6-month old ApoE/LDLR−/− mouse fed LCHP diet [91]. the measured part of
BCA tissue is presented in the red frame. b the K-means Clustering (KmC) results with the five
main classes which were chosen artificially to represent the morphology of the sample. Classes
include remodeled media, heme, internal elastic lamina/fibrous cap, lipids and calcium nodule. c
the average spectra of the respective 5 classes. the spectrum which represents the pure calcification nodule ( gray spectrum) was distinguished from the class which originates from calcification
and lipids ( bottom, yellow spectrum). d Code color for presented in the figure classes
522
Fig. 17.6 a A visual image focused on the cross-sections of a brachiocephalic artery (BCA)
coming from a 6-month old ApoE/LDLR−/− mouse fed LCHP diet [91]. the measured part of
BCA tissue is presented in the red frame. b the K-means Clustering (KmC) results with the five
main classes which were chosen artificially to represent the morphology of the sample. Classes
include remodeled media, heme, internal elastic lamina/fibrous cap, lipids and calcium nodule. c
the average spectra of the respective 5 classes. the spectrum which represents the pure calcification nodule ( gray spectrum) was distinguished from the class which originates from calcification
and lipids ( bottom, yellow spectrum). d Code color for presented in the figure classes