

T.P. Wróbel et al.
516
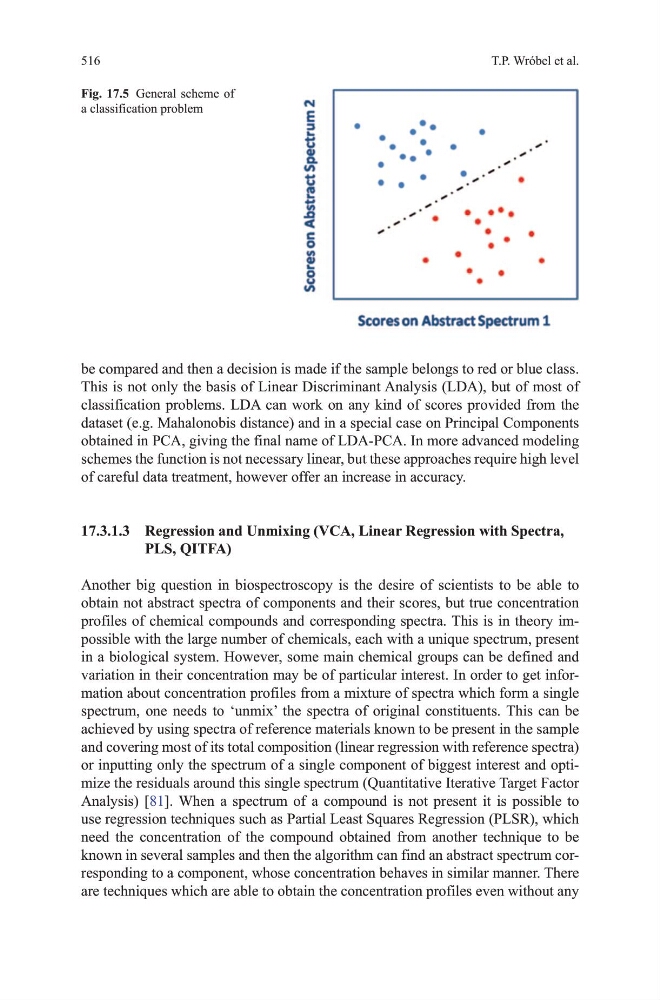
be compared and then a decision is made if the sample belongs to red or blue class.
this is not only the basis of Linear discriminant Analysis (LdA), but of most of
classification problems. LdA can work on any kind of scores provided from the
dataset (e.g. mahalonobis distance) and in a special case on Principal Components
obtained in PCA, giving the final name of LdA-PCA. In more advanced modeling
schemes the function is not necessary linear, but these approaches require high level
of careful data treatment, however offer an increase in accuracy.
17.3.1.3 Regression and Unmixing (VCA, Linear Regression with Spectra,
PLS, QITFA)
Another big question in biospectroscopy is the desire of scientists to be able to
obtain not abstract spectra of components and their scores, but true concentration
profiles of chemical compounds and corresponding spectra. this is in theory impossible with the large number of chemicals, each with a unique spectrum, present
in a biological system. however, some main chemical groups can be defined and
variation in their concentration may be of particular interest. In order to get information about concentration profiles from a mixture of spectra which form a single
spectrum, one needs to ‘unmix’ the spectra of original constituents. this can be
achieved by using spectra of reference materials known to be present in the sample
and covering most of its total composition (linear regression with reference spectra)
or inputting only the spectrum of a single component of biggest interest and optimize the residuals around this single spectrum (Quantitative Iterative target Factor
Analysis) [81]. When a spectrum of a compound is not present it is possible to
use regression techniques such as Partial Least Squares Regression (PLSR), which
need the concentration of the compound obtained from another technique to be
known in several samples and then the algorithm can find an abstract spectrum corresponding to a component, whose concentration behaves in similar manner. there
are techniques which are able to obtain the concentration profiles even without any
Fig. 17.5 general scheme of
a classification problem
516
be compared and then a decision is made if the sample belongs to red or blue class.
this is not only the basis of Linear discriminant Analysis (LdA), but of most of
classification problems. LdA can work on any kind of scores provided from the
dataset (e.g. mahalonobis distance) and in a special case on Principal Components
obtained in PCA, giving the final name of LdA-PCA. In more advanced modeling
schemes the function is not necessary linear, but these approaches require high level
of careful data treatment, however offer an increase in accuracy.
17.3.1.3 Regression and Unmixing (VCA, Linear Regression with Spectra,
PLS, QITFA)
Another big question in biospectroscopy is the desire of scientists to be able to
obtain not abstract spectra of components and their scores, but true concentration
profiles of chemical compounds and corresponding spectra. this is in theory impossible with the large number of chemicals, each with a unique spectrum, present
in a biological system. however, some main chemical groups can be defined and
variation in their concentration may be of particular interest. In order to get information about concentration profiles from a mixture of spectra which form a single
spectrum, one needs to ‘unmix’ the spectra of original constituents. this can be
achieved by using spectra of reference materials known to be present in the sample
and covering most of its total composition (linear regression with reference spectra)
or inputting only the spectrum of a single component of biggest interest and optimize the residuals around this single spectrum (Quantitative Iterative target Factor
Analysis) [81]. When a spectrum of a compound is not present it is possible to
use regression techniques such as Partial Least Squares Regression (PLSR), which
need the concentration of the compound obtained from another technique to be
known in several samples and then the algorithm can find an abstract spectrum corresponding to a component, whose concentration behaves in similar manner. there
are techniques which are able to obtain the concentration profiles even without any
Fig. 17.5 general scheme of
a classification problem