

495
16 Fourier Transform Infrared (Ft-Ir) Spectroscopic Imaging …
AtR Ft-IR imaging has been used recently to chemically characterize smallersized cells and finer morphologic structures such as endothelial cells, myoepithelial
cells and terminal ductal lobular units, which are usually inaccessible by transmission mode imaging. In addition to smaller cells and structures, the approach was
extended to study sub-cellular structures. In this study, chromosomes extracted from
breast cancer cells were compared to normal cells for understanding the molecular
changes introduced in dNA. Ft-IR AtR spectra from the scalp and pubic hair
samples from patients having breast cancer and people without cancer were also
compared to differentiate between the molecular or chemical compositions in both
cases; hence opening up yet another possibility of analyzing breast cancer [54].
IR spectroscopy has been applied to differentiate two cell lines—mCF-7 (estrogen receptor expressed, ER +) and SKBr3 (estrogen receptor non-expressed, ER-)
both from the same breast cancer by the analysis of the chemical information available from the Ft-IR absorption spectra [55]. An attempt has also been made by our
group to characterize the stroma and study its transformations in epithelial tumor
progression. one of the characteristics of cancer-associated stroma is the fibroblastto-myofibroblast cellular transformation which is accompanied by the expression
of α-smooth muscle actin ( α-SmA). transformation of fibroblast-to-myofibroblast
was analysed in primary normal human dermal fibroblasts (NhdFs) activated with
tgFβ1, in cocultures of primary fibroblasts with tumorigenic breast epithelial cells
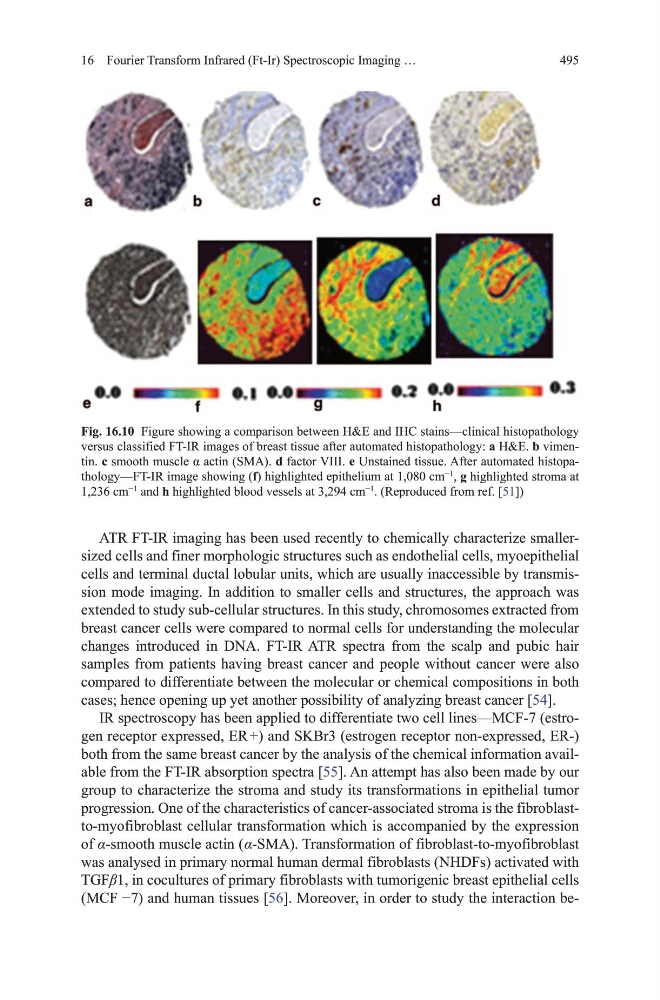
(MCF −7) and human tissues [56]. moreover, in order to study the interaction beFig. 16.10 Figure showing a comparison between h&E and IhC stains—clinical histopathology
versus classified Ft-IR images of breast tissue after automated histopathology: a h&E. b vimentin. c smooth muscle α actin (SMA). d factor vIII. e unstained tissue. After automated histopathology—Ft-IR image showing (f) highlighted epithelium at 1,080 cm
−1
, g highlighted stroma at
1,236 cm
−1
and h highlighted blood vessels at 3,294 cm
−1
. (Reproduced from ref. [51])
16 Fourier Transform Infrared (Ft-Ir) Spectroscopic Imaging …
AtR Ft-IR imaging has been used recently to chemically characterize smallersized cells and finer morphologic structures such as endothelial cells, myoepithelial
cells and terminal ductal lobular units, which are usually inaccessible by transmission mode imaging. In addition to smaller cells and structures, the approach was
extended to study sub-cellular structures. In this study, chromosomes extracted from
breast cancer cells were compared to normal cells for understanding the molecular
changes introduced in dNA. Ft-IR AtR spectra from the scalp and pubic hair
samples from patients having breast cancer and people without cancer were also
compared to differentiate between the molecular or chemical compositions in both
cases; hence opening up yet another possibility of analyzing breast cancer [54].
IR spectroscopy has been applied to differentiate two cell lines—mCF-7 (estrogen receptor expressed, ER +) and SKBr3 (estrogen receptor non-expressed, ER-)
both from the same breast cancer by the analysis of the chemical information available from the Ft-IR absorption spectra [55]. An attempt has also been made by our
group to characterize the stroma and study its transformations in epithelial tumor
progression. one of the characteristics of cancer-associated stroma is the fibroblastto-myofibroblast cellular transformation which is accompanied by the expression
of α-smooth muscle actin ( α-SmA). transformation of fibroblast-to-myofibroblast
was analysed in primary normal human dermal fibroblasts (NhdFs) activated with
tgFβ1, in cocultures of primary fibroblasts with tumorigenic breast epithelial cells
(MCF −7) and human tissues [56]. moreover, in order to study the interaction beFig. 16.10 Figure showing a comparison between h&E and IhC stains—clinical histopathology
versus classified Ft-IR images of breast tissue after automated histopathology: a h&E. b vimentin. c smooth muscle α actin (SMA). d factor vIII. e unstained tissue. After automated histopathology—Ft-IR image showing (f) highlighted epithelium at 1,080 cm
−1
, g highlighted stroma at
1,236 cm
−1
and h highlighted blood vessels at 3,294 cm
−1
. (Reproduced from ref. [51])