

493
16 Fourier Transform Infrared (Ft-Ir) Spectroscopic Imaging …
Let us examine an example of Supervised Learning in more detail. Figure 16.8
and will help in visualizing the steps involved. First we select a prostate tissue microarray as our data set. Next, the data are subjected to minimum Noise Fraction for
reducing noise, a scaled water vapor spectrum is employed to eliminate atmospheric
interferences and spectra are all baseline corrected in a consistent manner. Absorbance images for some common features are employed to examine the data by comparing the various cell types of interest with a gold standard. Commonly, the gold
standard is a visible microcopy image that is a corresponding tissue section stained
with hematoxylin and eosin (h&E) and one in which a pathologist has recognized
various entities of interest. Specialized immunohistochemical stains may also be employed, for example, smooth muscle-α (SMA) stain for identifying myofibroblasts,
smooth muscles and myoepithelial tissue. the use of IhC may be difficult, however,
and is not recommended to be used as the sole standard for a variety of reasons.
Regions corresponding to different classes of cells are marked on the images as Regions of Interest (RoI) and the biochemical information inherent in RoI is extracted
from the IR absorbance spectra. Potentially significant features from the absorption
spectra are recognized, which defines the metrics to be used. Subsequently, computer algorithms are employed for training using the marked pixels as well as the
selected metrics. Classification accuracy is optimized and statistics obtained. the
developed classifier is finally run on the validation data set and quantitation of the
accuracy of the classifier is obtained. We additionally test our data for robustness,
for example, by decreasing signal to noise ratio until classifier fails, to determine
the conditions under which it is bound. Finally, an optimized algorithm, metric set,
calibration and validation statistics as well robustness analysis is obtained. together,
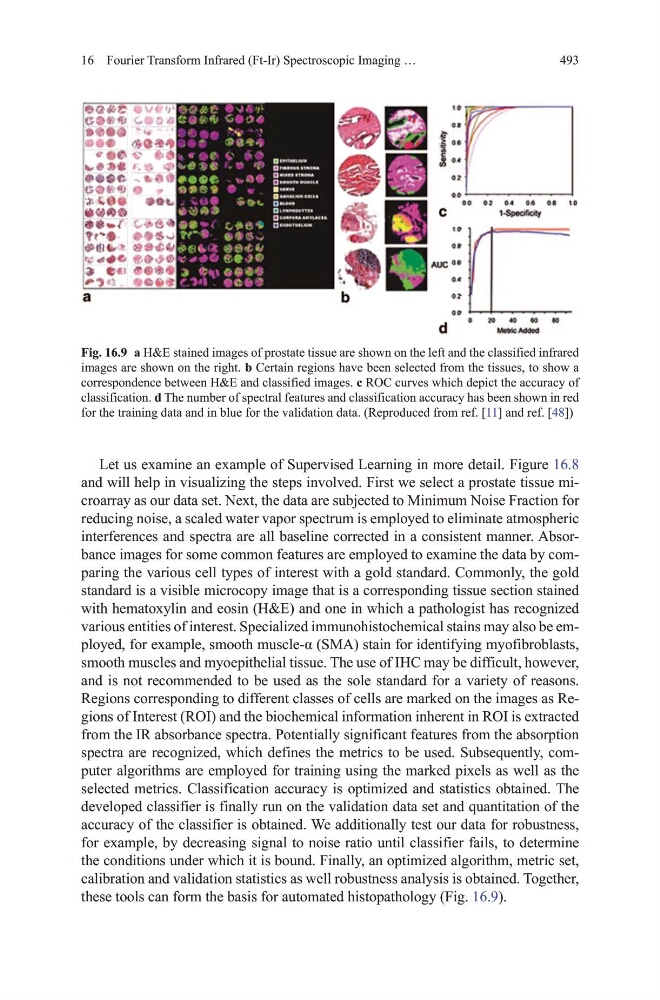
these tools can form the basis for automated histopathology (Fig. 16.9).
Fig. 16.9 a h&E stained images of prostate tissue are shown on the left and the classified infrared
images are shown on the right. b Certain regions have been selected from the tissues, to show a
correspondence between h&E and classified images. c RoC curves which depict the accuracy of
classification. d the number of spectral features and classification accuracy has been shown in red
for the training data and in blue for the validation data. (Reproduced from ref. [11] and ref. [48])
16 Fourier Transform Infrared (Ft-Ir) Spectroscopic Imaging …
Let us examine an example of Supervised Learning in more detail. Figure 16.8
and will help in visualizing the steps involved. First we select a prostate tissue microarray as our data set. Next, the data are subjected to minimum Noise Fraction for
reducing noise, a scaled water vapor spectrum is employed to eliminate atmospheric
interferences and spectra are all baseline corrected in a consistent manner. Absorbance images for some common features are employed to examine the data by comparing the various cell types of interest with a gold standard. Commonly, the gold
standard is a visible microcopy image that is a corresponding tissue section stained
with hematoxylin and eosin (h&E) and one in which a pathologist has recognized
various entities of interest. Specialized immunohistochemical stains may also be employed, for example, smooth muscle-α (SMA) stain for identifying myofibroblasts,
smooth muscles and myoepithelial tissue. the use of IhC may be difficult, however,
and is not recommended to be used as the sole standard for a variety of reasons.
Regions corresponding to different classes of cells are marked on the images as Regions of Interest (RoI) and the biochemical information inherent in RoI is extracted
from the IR absorbance spectra. Potentially significant features from the absorption
spectra are recognized, which defines the metrics to be used. Subsequently, computer algorithms are employed for training using the marked pixels as well as the
selected metrics. Classification accuracy is optimized and statistics obtained. the
developed classifier is finally run on the validation data set and quantitation of the
accuracy of the classifier is obtained. We additionally test our data for robustness,
for example, by decreasing signal to noise ratio until classifier fails, to determine
the conditions under which it is bound. Finally, an optimized algorithm, metric set,
calibration and validation statistics as well robustness analysis is obtained. together,
these tools can form the basis for automated histopathology (Fig. 16.9).
Fig. 16.9 a h&E stained images of prostate tissue are shown on the left and the classified infrared
images are shown on the right. b Certain regions have been selected from the tissues, to show a
correspondence between h&E and classified images. c RoC curves which depict the accuracy of
classification. d the number of spectral features and classification accuracy has been shown in red
for the training data and in blue for the validation data. (Reproduced from ref. [11] and ref. [48])