

487
16 Fourier Transform Infrared (Ft-Ir) Spectroscopic Imaging …
both macroscopic effects such as refraction and reflection as well as progressively
structure-dependent effects including scattering and changes in the interaction volume of the sample. Light interaction consists of the more obvious absorbance arising from the imaginary part of the refractive index and others that result in no loss of
intensity but changes in phase (direction) arising from the real part of the refractive
index. Since the real and imaginary parts of the refractive index are coupled, optical phenomena primarily associated with one or the other affect images with either
contrast mechanism.
Electromagnetic theory can provide a detailed analysis of the optical physics
involved in IR imaging and has been recently used to describe the image formation process. Application to increasingly complex shapes and geometries has been
provided in a series of papers. typically, in this approach, electric and magnetic
fields associated with a monochromatic plane wave are considered to be the building blocks in the theoretical treatment. the system is assumed to be linear; hence,
summation of individual plane waves can be applied to reconstruct the field as
well as all linear transformations of the electomagnetic field. For each plane wave
constituting the electromagnetic field, its quantitative contribution is given by the
amplitude and its relative position is given by the phase. By propagating a collection of plane waves through the instrument and interactions with the sample, precise
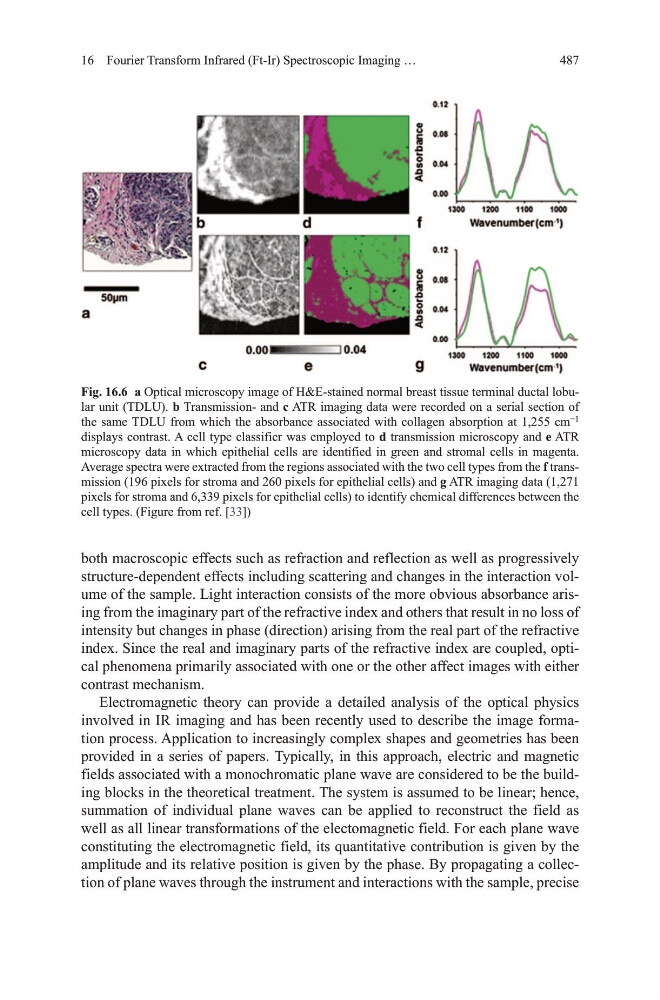
Fig. 16.6 a optical microscopy image of h&E-stained normal breast tissue terminal ductal lobular unit (tdLu). b transmission- and c AtR imaging data were recorded on a serial section of
the same tdLu from which the absorbance associated with collagen absorption at 1,255 cm
−1
displays contrast. A cell type classifier was employed to d transmission microscopy and e AtR
microscopy data in which epithelial cells are identified in green and stromal cells in magenta.
Average spectra were extracted from the regions associated with the two cell types from the f transmission (196 pixels for stroma and 260 pixels for epithelial cells) and g AtR imaging data (1,271
pixels for stroma and 6,339 pixels for epithelial cells) to identify chemical differences between the
cell types. (Figure from ref. [33])
16 Fourier Transform Infrared (Ft-Ir) Spectroscopic Imaging …
both macroscopic effects such as refraction and reflection as well as progressively
structure-dependent effects including scattering and changes in the interaction volume of the sample. Light interaction consists of the more obvious absorbance arising from the imaginary part of the refractive index and others that result in no loss of
intensity but changes in phase (direction) arising from the real part of the refractive
index. Since the real and imaginary parts of the refractive index are coupled, optical phenomena primarily associated with one or the other affect images with either
contrast mechanism.
Electromagnetic theory can provide a detailed analysis of the optical physics
involved in IR imaging and has been recently used to describe the image formation process. Application to increasingly complex shapes and geometries has been
provided in a series of papers. typically, in this approach, electric and magnetic
fields associated with a monochromatic plane wave are considered to be the building blocks in the theoretical treatment. the system is assumed to be linear; hence,
summation of individual plane waves can be applied to reconstruct the field as
well as all linear transformations of the electomagnetic field. For each plane wave
constituting the electromagnetic field, its quantitative contribution is given by the
amplitude and its relative position is given by the phase. By propagating a collection of plane waves through the instrument and interactions with the sample, precise
Fig. 16.6 a optical microscopy image of h&E-stained normal breast tissue terminal ductal lobular unit (tdLu). b transmission- and c AtR imaging data were recorded on a serial section of
the same tdLu from which the absorbance associated with collagen absorption at 1,255 cm
−1
displays contrast. A cell type classifier was employed to d transmission microscopy and e AtR
microscopy data in which epithelial cells are identified in green and stromal cells in magenta.
Average spectra were extracted from the regions associated with the two cell types from the f transmission (196 pixels for stroma and 260 pixels for epithelial cells) and g AtR imaging data (1,271
pixels for stroma and 6,339 pixels for epithelial cells) to identify chemical differences between the
cell types. (Figure from ref. [33])