

438
K. malek et al.
15.4.1 Data Pre-Processing Steps
15.4.1.1 Baseline Correction and Derivative Analysis
Baseline aberrations in FtIR image data can result from mie scattering due to particles that are in the range of infrared wavelengths typically between 2.5 μm and
25 μm or from light dispersion from tissue boundaries where there is a large change
in the refractive index compared to the background measurement. other baseline
features can arise due to detector cut off and substrate effects. Environmental effects like heating can also cause baseline offsets. If the baseline effect were simply
caused by an offset due to heating of the sample then a linear baseline correction
would suffice. If the base line exhibits a gentle curve then a polynomial approach
may be required [64]. these approaches work well when quantification based on
integrated area under a peak or a ratio of two bands would suffice in the analysis.
For data that will be used in modelling or a search database it is often better to
perform a derivative to remove the baseline contribution. this has the added advantage of better resolving the absorption bands, which are often broad and overlapped.
First derivatives emphasize bandwidths, because the first derivatives of most band
shapes have maxima or minima near 75 % of the original peak height [65]. to this
aim, the second derivative analysis is widely applied to the measured spectra as
it highlights band positions and separations. In a second derivative spectrum, the
overlapping absorption components in the spectrum are displayed as negative
bands. this analysis requires spectra with high signal-to-noise ratio and free of vapour absorption, as second derivative band intensity is inversely proportional to the
square of the original band half-width, this leads to an enhancement of the relative
contribution of sharp lines due to noise and vapour.
the theory is based on the original work by Butler and hopkins in 1970 [66] and
further modified by Susi and Byler [67]. the following description and notation is
based on the theory and notation proposed by Susi and Byler [67].
FtIR spectra are digitally encoded with one data point n every Δk/(2
m
) = ΔW frequency units, where Δk is the nominal instrumental resolution selected in cm
−1
, m is
the number of times the interferogram is zero-filled before the Fourier transform is
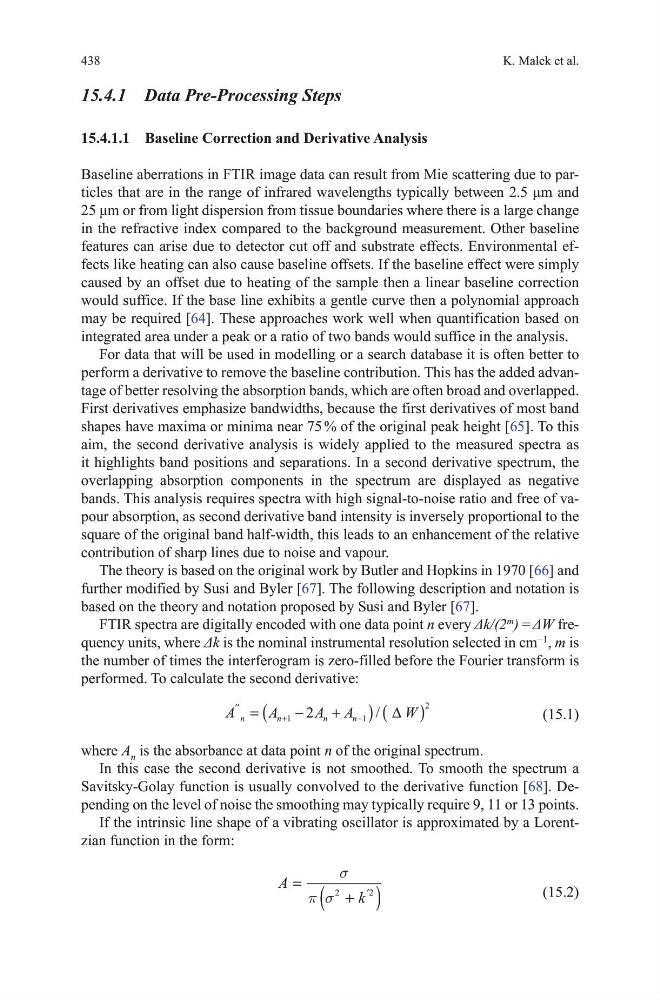
performed. to calculate the second derivative:
A
A
A A
W
n
n
n
n
′′
+
−
=
−
+
(
)(
)
1
1
2
2
/ ∆
(15.1)
where A n is the absorbance at data point n of the original spectrum.
In this case the second derivative is not smoothed. to smooth the spectrum a
Savitsky-golay function is usually convolved to the derivative function [68]. depending on the level of noise the smoothing may typically require 9, 11 or 13 points.
If the intrinsic line shape of a vibrating oscillator is approximated by a Lorentzian function in the form:
A
k
=
+
(
)
′
σ
π σ
2
2
(15.2)
K. malek et al.
15.4.1 Data Pre-Processing Steps
15.4.1.1 Baseline Correction and Derivative Analysis
Baseline aberrations in FtIR image data can result from mie scattering due to particles that are in the range of infrared wavelengths typically between 2.5 μm and
25 μm or from light dispersion from tissue boundaries where there is a large change
in the refractive index compared to the background measurement. other baseline
features can arise due to detector cut off and substrate effects. Environmental effects like heating can also cause baseline offsets. If the baseline effect were simply
caused by an offset due to heating of the sample then a linear baseline correction
would suffice. If the base line exhibits a gentle curve then a polynomial approach
may be required [64]. these approaches work well when quantification based on
integrated area under a peak or a ratio of two bands would suffice in the analysis.
For data that will be used in modelling or a search database it is often better to
perform a derivative to remove the baseline contribution. this has the added advantage of better resolving the absorption bands, which are often broad and overlapped.
First derivatives emphasize bandwidths, because the first derivatives of most band
shapes have maxima or minima near 75 % of the original peak height [65]. to this
aim, the second derivative analysis is widely applied to the measured spectra as
it highlights band positions and separations. In a second derivative spectrum, the
overlapping absorption components in the spectrum are displayed as negative
bands. this analysis requires spectra with high signal-to-noise ratio and free of vapour absorption, as second derivative band intensity is inversely proportional to the
square of the original band half-width, this leads to an enhancement of the relative
contribution of sharp lines due to noise and vapour.
the theory is based on the original work by Butler and hopkins in 1970 [66] and
further modified by Susi and Byler [67]. the following description and notation is
based on the theory and notation proposed by Susi and Byler [67].
FtIR spectra are digitally encoded with one data point n every Δk/(2
m
) = ΔW frequency units, where Δk is the nominal instrumental resolution selected in cm
−1
, m is
the number of times the interferogram is zero-filled before the Fourier transform is
performed. to calculate the second derivative:
A
A
A A
W
n
n
n
n
′′
+
−
=
−
+
(
)(
)
1
1
2
2
/ ∆
(15.1)
where A n is the absorbance at data point n of the original spectrum.
In this case the second derivative is not smoothed. to smooth the spectrum a
Savitsky-golay function is usually convolved to the derivative function [68]. depending on the level of noise the smoothing may typically require 9, 11 or 13 points.
If the intrinsic line shape of a vibrating oscillator is approximated by a Lorentzian function in the form:
A
k
=
+
(
)
′
σ
π σ
2
2
(15.2)