

431
15 FtIR Imaging of tissues: techniques and methods of Analysis
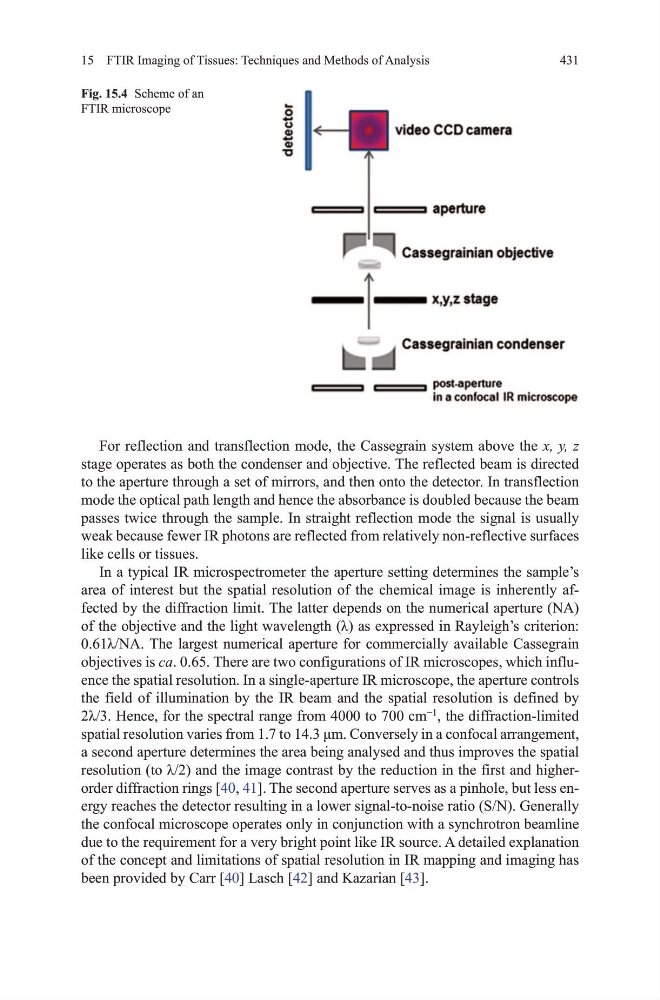
For reflection and transflection mode, the Cassegrain system above the x, y, z
stage operates as both the condenser and objective. the reflected beam is directed
to the aperture through a set of mirrors, and then onto the detector. In transflection
mode the optical path length and hence the absorbance is doubled because the beam
passes twice through the sample. In straight reflection mode the signal is usually
weak because fewer IR photons are reflected from relatively non-reflective surfaces
like cells or tissues.
In a typical IR microspectrometer the aperture setting determines the sample’s
area of interest but the spatial resolution of the chemical image is inherently affected by the diffraction limit. the latter depends on the numerical aperture (NA)
of the objective and the light wavelength (λ) as expressed in Rayleigh’s criterion:
0.61λ/NA. The largest numerical aperture for commercially available Cassegrain
objectives is ca. 0.65. there are two configurations of IR microscopes, which influence the spatial resolution. In a single-aperture IR microscope, the aperture controls
the field of illumination by the IR beam and the spatial resolution is defined by
2λ/3. Hence, for the spectral range from 4000 to 700 cm
−1
, the diffraction-limited
spatial resolution varies from 1.7 to 14.3 μm. Conversely in a confocal arrangement,
a second aperture determines the area being analysed and thus improves the spatial
resolution (to λ/2) and the image contrast by the reduction in the first and higherorder diffraction rings [40, 41]. the second aperture serves as a pinhole, but less energy reaches the detector resulting in a lower signal-to-noise ratio (S/N). generally
the confocal microscope operates only in conjunction with a synchrotron beamline
due to the requirement for a very bright point like IR source. A detailed explanation
of the concept and limitations of spatial resolution in IR mapping and imaging has
been provided by Carr [40] Lasch [42] and Kazarian [43].
Fig. 15.4 Scheme of an
FtIR microscope
15 FtIR Imaging of tissues: techniques and methods of Analysis
For reflection and transflection mode, the Cassegrain system above the x, y, z
stage operates as both the condenser and objective. the reflected beam is directed
to the aperture through a set of mirrors, and then onto the detector. In transflection
mode the optical path length and hence the absorbance is doubled because the beam
passes twice through the sample. In straight reflection mode the signal is usually
weak because fewer IR photons are reflected from relatively non-reflective surfaces
like cells or tissues.
In a typical IR microspectrometer the aperture setting determines the sample’s
area of interest but the spatial resolution of the chemical image is inherently affected by the diffraction limit. the latter depends on the numerical aperture (NA)
of the objective and the light wavelength (λ) as expressed in Rayleigh’s criterion:
0.61λ/NA. The largest numerical aperture for commercially available Cassegrain
objectives is ca. 0.65. there are two configurations of IR microscopes, which influence the spatial resolution. In a single-aperture IR microscope, the aperture controls
the field of illumination by the IR beam and the spatial resolution is defined by
2λ/3. Hence, for the spectral range from 4000 to 700 cm
−1
, the diffraction-limited
spatial resolution varies from 1.7 to 14.3 μm. Conversely in a confocal arrangement,
a second aperture determines the area being analysed and thus improves the spatial
resolution (to λ/2) and the image contrast by the reduction in the first and higherorder diffraction rings [40, 41]. the second aperture serves as a pinhole, but less energy reaches the detector resulting in a lower signal-to-noise ratio (S/N). generally
the confocal microscope operates only in conjunction with a synchrotron beamline
due to the requirement for a very bright point like IR source. A detailed explanation
of the concept and limitations of spatial resolution in IR mapping and imaging has
been provided by Carr [40] Lasch [42] and Kazarian [43].
Fig. 15.4 Scheme of an
FtIR microscope