

429
15 FtIR Imaging of tissues: techniques and methods of Analysis
dependent on the conformation of the dNA. In low ionic strength solutions, native dNAs and most synthetic double-strand poly- and oligonucleotides adopt a
B-form conformation. under the same conditions double-stranded RNAs adopt an
A-type conformation [37]. In the A-dNA conformation, which is the case for all
dehydrated cells and tissues, the band appears at ~ 1244 cm
−1
, while in the B-dNA
conformation, which is the case for live and hydrated cells, it appears at ~ 1225 cm
−1
[11]. the intensity of the symmetric phosphate stretch is very sensitive to hydration
and appears much stronger in hydrated cells and tissues compared to fixed or dehydrated samples. In fact it has been shown that a spectrum of an air-dried enucleated
human erythrocyte is almost identical to a spectrum of an air-dried nucleated avian
erythrocyte in the phosphodiester region [38]. It is only when the avian erythrocyte
is hydrated that one clearly observes the dNA bands and in this state they can
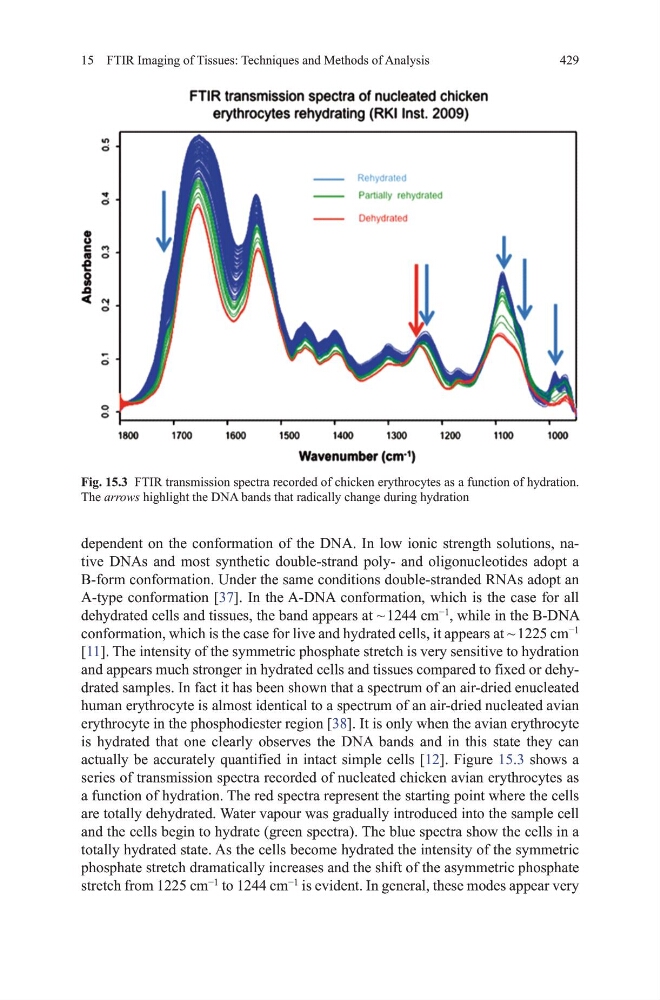
actually be accurately quantified in intact simple cells [12]. Figure 15.3 shows a
series of transmission spectra recorded of nucleated chicken avian erythrocytes as
a function of hydration. the red spectra represent the starting point where the cells
are totally dehydrated. Water vapour was gradually introduced into the sample cell
and the cells begin to hydrate (green spectra). the blue spectra show the cells in a
totally hydrated state. As the cells become hydrated the intensity of the symmetric
phosphate stretch dramatically increases and the shift of the asymmetric phosphate
stretch from 1225 cm
−1
to 1244 cm
−1
is evident. In general, these modes appear very
Fig. 15.3 FtIR transmission spectra recorded of chicken erythrocytes as a function of hydration.
the arrows highlight the dNA bands that radically change during hydration
15 FtIR Imaging of tissues: techniques and methods of Analysis
dependent on the conformation of the dNA. In low ionic strength solutions, native dNAs and most synthetic double-strand poly- and oligonucleotides adopt a
B-form conformation. under the same conditions double-stranded RNAs adopt an
A-type conformation [37]. In the A-dNA conformation, which is the case for all
dehydrated cells and tissues, the band appears at ~ 1244 cm
−1
, while in the B-dNA
conformation, which is the case for live and hydrated cells, it appears at ~ 1225 cm
−1
[11]. the intensity of the symmetric phosphate stretch is very sensitive to hydration
and appears much stronger in hydrated cells and tissues compared to fixed or dehydrated samples. In fact it has been shown that a spectrum of an air-dried enucleated
human erythrocyte is almost identical to a spectrum of an air-dried nucleated avian
erythrocyte in the phosphodiester region [38]. It is only when the avian erythrocyte
is hydrated that one clearly observes the dNA bands and in this state they can
actually be accurately quantified in intact simple cells [12]. Figure 15.3 shows a
series of transmission spectra recorded of nucleated chicken avian erythrocytes as
a function of hydration. the red spectra represent the starting point where the cells
are totally dehydrated. Water vapour was gradually introduced into the sample cell
and the cells begin to hydrate (green spectra). the blue spectra show the cells in a
totally hydrated state. As the cells become hydrated the intensity of the symmetric
phosphate stretch dramatically increases and the shift of the asymmetric phosphate
stretch from 1225 cm
−1
to 1244 cm
−1
is evident. In general, these modes appear very
Fig. 15.3 FtIR transmission spectra recorded of chicken erythrocytes as a function of hydration.
the arrows highlight the dNA bands that radically change during hydration