

427
15 FtIR Imaging of tissues: techniques and methods of Analysis
presence of the glycogen spectral features was used for discrimination of normal
epithelial cells of the cervix and the oesophagus from those with cancerous features
[19, 31]. the glycogen bands at 1080 and 1028 cm
−1
may often obscure the nucleic
acids bands and can confound disease diagnosis. In turn, IR maxima at 1150 and
1050 cm
−1
found in spectra of the oral mucosa, cervical cells, and cytoplasm of
glandular cells were assigned to mucin consisting of glycosylated proteins [32, 33].
In fact, mucus containing mucin covers the surface of cells, while glandular cells
secrete mucin. the 1050 cm
−1
band of mucin can mask the 1038 cm
−1
band attributed to dNA and RNA.
15.2.4 Ribonucleic Acid (RNA)
FtIR spectra of nucleic acids show in general a number of characteristic bands. As
expected, they originate from modes of the acid constitutes, i.e. the C = o and ring
CC stretching modes of the purine and pyrimidine bases (in the region of 1720–
1600 cm
−1
), the asymmetric and symmetric stretches of the phosphate group as
well as stretches of the C-o bonds in the phosphodiester and sugar moieties (in the
region of 1300–900 cm
−1
). For a dry sample of a cell or a tissue, the most characteristic bands appear in the entire fingerprint region, see table 15.1. however, IR
bands of nucleic acids in the region of 1720–1600 cm
−1
are overlapped by protein
bands that always appear in samples of animal/human origin. therefore, the presence of nucleic acids is predominantly revealed by IR bands in the 1300–900 cm
−1
region (c.f. Fig. 15.1), and are dramatically affected by environmental factors and
are only observed in the absence of glycogen [27]. the spectral profiles of both
dNA and RNA are significantly distinct, making FtIR analysis a useful tool for
monitoring structural and content modifications of these principal constituents of
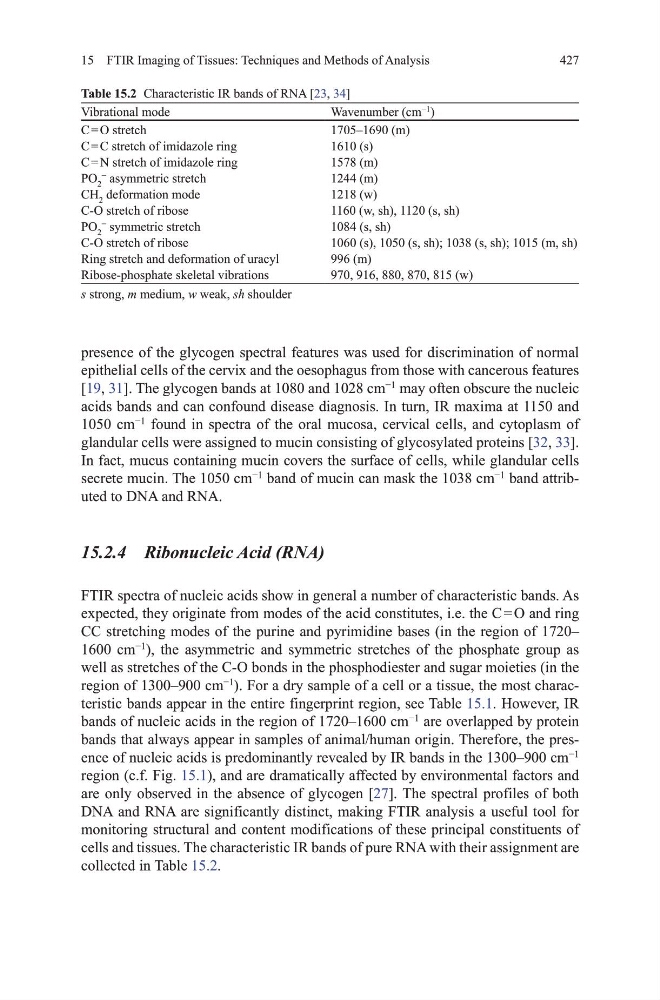
cells and tissues. the characteristic IR bands of pure RNA with their assignment are
collected in table 15.2.
Table 15.2 Characteristic IR bands of RNA [23, 34]
vibrational mode
Wavenumber (cm
−1
)
C = o stretch
1705–1690 (m)
C = C stretch of imidazole ring
1610 (s)
C = N stretch of imidazole ring
1578 (m)
Po 2
−
asymmetric stretch
1244 (m)
Ch 2 deformation mode
1218 (w)
C-o stretch of ribose
1160 (w, sh), 1120 (s, sh)
Po 2
−
symmetric stretch
1084 (s, sh)
C-o stretch of ribose
1060 (s), 1050 (s, sh); 1038 (s, sh); 1015 (m, sh)
Ring stretch and deformation of uracyl
996 (m)
Ribose-phosphate skeletal vibrations
970, 916, 880, 870, 815 (w)
s strong, m medium, w weak, sh shoulder
15 FtIR Imaging of tissues: techniques and methods of Analysis
presence of the glycogen spectral features was used for discrimination of normal
epithelial cells of the cervix and the oesophagus from those with cancerous features
[19, 31]. the glycogen bands at 1080 and 1028 cm
−1
may often obscure the nucleic
acids bands and can confound disease diagnosis. In turn, IR maxima at 1150 and
1050 cm
−1
found in spectra of the oral mucosa, cervical cells, and cytoplasm of
glandular cells were assigned to mucin consisting of glycosylated proteins [32, 33].
In fact, mucus containing mucin covers the surface of cells, while glandular cells
secrete mucin. the 1050 cm
−1
band of mucin can mask the 1038 cm
−1
band attributed to dNA and RNA.
15.2.4 Ribonucleic Acid (RNA)
FtIR spectra of nucleic acids show in general a number of characteristic bands. As
expected, they originate from modes of the acid constitutes, i.e. the C = o and ring
CC stretching modes of the purine and pyrimidine bases (in the region of 1720–
1600 cm
−1
), the asymmetric and symmetric stretches of the phosphate group as
well as stretches of the C-o bonds in the phosphodiester and sugar moieties (in the
region of 1300–900 cm
−1
). For a dry sample of a cell or a tissue, the most characteristic bands appear in the entire fingerprint region, see table 15.1. however, IR
bands of nucleic acids in the region of 1720–1600 cm
−1
are overlapped by protein
bands that always appear in samples of animal/human origin. therefore, the presence of nucleic acids is predominantly revealed by IR bands in the 1300–900 cm
−1
region (c.f. Fig. 15.1), and are dramatically affected by environmental factors and
are only observed in the absence of glycogen [27]. the spectral profiles of both
dNA and RNA are significantly distinct, making FtIR analysis a useful tool for
monitoring structural and content modifications of these principal constituents of
cells and tissues. the characteristic IR bands of pure RNA with their assignment are
collected in table 15.2.
Table 15.2 Characteristic IR bands of RNA [23, 34]
vibrational mode
Wavenumber (cm
−1
)
C = o stretch
1705–1690 (m)
C = C stretch of imidazole ring
1610 (s)
C = N stretch of imidazole ring
1578 (m)
Po 2
−
asymmetric stretch
1244 (m)
Ch 2 deformation mode
1218 (w)
C-o stretch of ribose
1160 (w, sh), 1120 (s, sh)
Po 2
−
symmetric stretch
1084 (s, sh)
C-o stretch of ribose
1060 (s), 1050 (s, sh); 1038 (s, sh); 1015 (m, sh)
Ring stretch and deformation of uracyl
996 (m)
Ribose-phosphate skeletal vibrations
970, 916, 880, 870, 815 (w)
s strong, m medium, w weak, sh shoulder