

380
H. J. Byrne et al.
ent substrates and a 285 % increase in viability was observed. Furthermore, after
polymerization, the density of the collagen is too low to give any contribution in
the spectra recorded [119]. Also no contribution from the medium used for the cell
culture is observable in the spectra recorded which allows the cells to be kept alive
for prolonged periods and spectroscopically monitored, effectively in real time.
After growing A549 and haCat (immortalised human keratinocyte) cells for
24 h on collagen gels, the medium was substituted by NaCl before mapping, as
the phenol red of the cell growth medium limits the visibility of the cells [119].
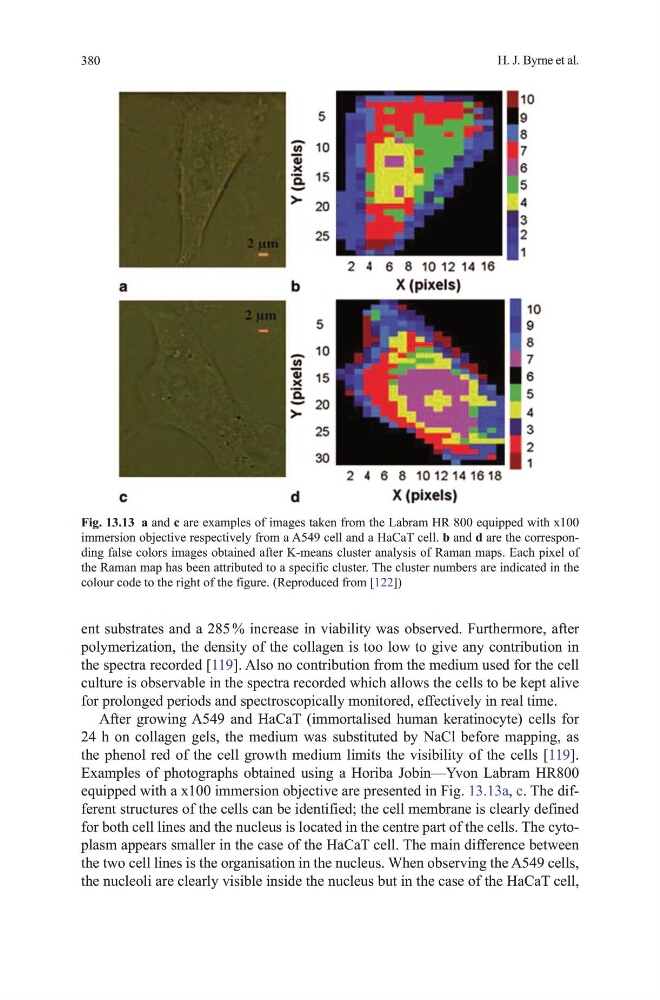
Examples of photographs obtained using a horiba Jobin—Yvon Labram hR800
equipped with a x100 immersion objective are presented in Fig. 13.13a, c. the different structures of the cells can be identified; the cell membrane is clearly defined
for both cell lines and the nucleus is located in the centre part of the cells. the cytoplasm appears smaller in the case of the haCat cell. the main difference between
the two cell lines is the organisation in the nucleus. When observing the A549 cells,
the nucleoli are clearly visible inside the nucleus but in the case of the haCat cell,
Fig. 13.13 a and c are examples of images taken from the Labram hR 800 equipped with x100
immersion objective respectively from a A549 cell and a haCat cell. b and d are the corresponding false colors images obtained after K-means cluster analysis of Raman maps. Each pixel of
the Raman map has been attributed to a specific cluster. the cluster numbers are indicated in the
colour code to the right of the figure. (Reproduced from [122])
H. J. Byrne et al.
ent substrates and a 285 % increase in viability was observed. Furthermore, after
polymerization, the density of the collagen is too low to give any contribution in
the spectra recorded [119]. Also no contribution from the medium used for the cell
culture is observable in the spectra recorded which allows the cells to be kept alive
for prolonged periods and spectroscopically monitored, effectively in real time.
After growing A549 and haCat (immortalised human keratinocyte) cells for
24 h on collagen gels, the medium was substituted by NaCl before mapping, as
the phenol red of the cell growth medium limits the visibility of the cells [119].
Examples of photographs obtained using a horiba Jobin—Yvon Labram hR800
equipped with a x100 immersion objective are presented in Fig. 13.13a, c. the different structures of the cells can be identified; the cell membrane is clearly defined
for both cell lines and the nucleus is located in the centre part of the cells. the cytoplasm appears smaller in the case of the haCat cell. the main difference between
the two cell lines is the organisation in the nucleus. When observing the A549 cells,
the nucleoli are clearly visible inside the nucleus but in the case of the haCat cell,
Fig. 13.13 a and c are examples of images taken from the Labram hR 800 equipped with x100
immersion objective respectively from a A549 cell and a haCat cell. b and d are the corresponding false colors images obtained after K-means cluster analysis of Raman maps. Each pixel of
the Raman map has been attributed to a specific cluster. the cluster numbers are indicated in the
colour code to the right of the figure. (Reproduced from [122])