

378
H. J. Byrne et al.
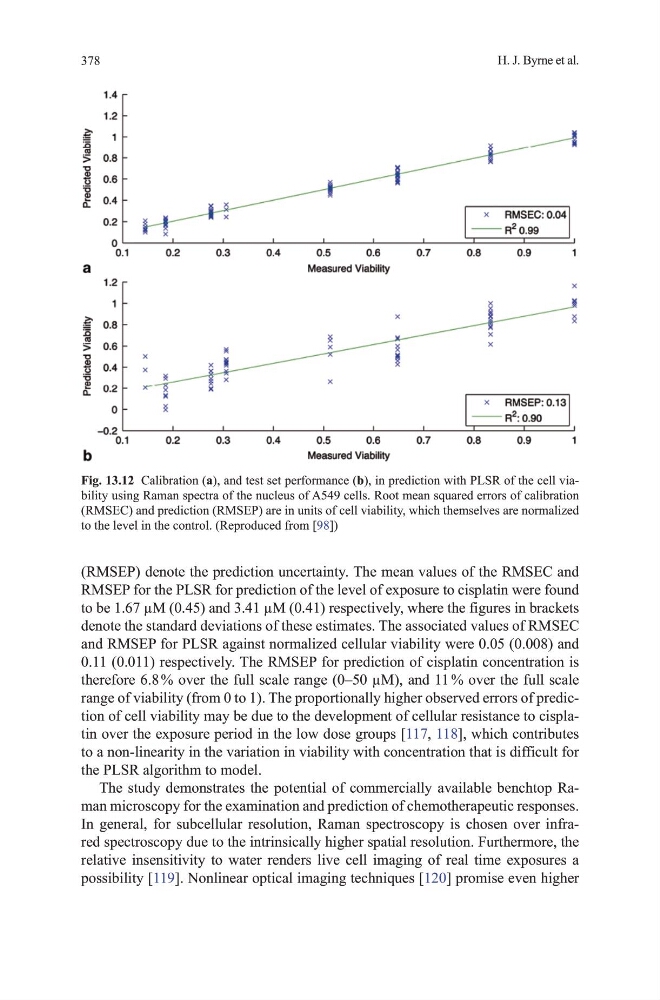
(RmSEP) denote the prediction uncertainty. the mean values of the RmSEC and
RmSEP for the PLSR for prediction of the level of exposure to cisplatin were found
to be 1.67 µm (0.45) and 3.41 µm (0.41) respectively, where the figures in brackets
denote the standard deviations of these estimates. the associated values of RmSEC
and RmSEP for PLSR against normalized cellular viability were 0.05 (0.008) and
0.11 (0.011) respectively. the RmSEP for prediction of cisplatin concentration is
therefore 6.8 % over the full scale range (0–50 µm), and 11 % over the full scale
range of viability (from 0 to 1). the proportionally higher observed errors of prediction of cell viability may be due to the development of cellular resistance to cisplatin over the exposure period in the low dose groups [117, 118], which contributes
to a non-linearity in the variation in viability with concentration that is difficult for
the PLSR algorithm to model.
the study demonstrates the potential of commercially available benchtop Raman microscopy for the examination and prediction of chemotherapeutic responses.
In general, for subcellular resolution, Raman spectroscopy is chosen over infrared spectroscopy due to the intrinsically higher spatial resolution. Furthermore, the
relative insensitivity to water renders live cell imaging of real time exposures a
possibility [119]. Nonlinear optical imaging techniques [120] promise even higher
Fig. 13.12 Calibration (a), and test set performance (b), in prediction with PLSR of the cell viability using Raman spectra of the nucleus of A549 cells. Root mean squared errors of calibration
(RmSEC) and prediction (RmSEP) are in units of cell viability, which themselves are normalized
to the level in the control. (Reproduced from [98])
H. J. Byrne et al.
(RmSEP) denote the prediction uncertainty. the mean values of the RmSEC and
RmSEP for the PLSR for prediction of the level of exposure to cisplatin were found
to be 1.67 µm (0.45) and 3.41 µm (0.41) respectively, where the figures in brackets
denote the standard deviations of these estimates. the associated values of RmSEC
and RmSEP for PLSR against normalized cellular viability were 0.05 (0.008) and
0.11 (0.011) respectively. the RmSEP for prediction of cisplatin concentration is
therefore 6.8 % over the full scale range (0–50 µm), and 11 % over the full scale
range of viability (from 0 to 1). the proportionally higher observed errors of prediction of cell viability may be due to the development of cellular resistance to cisplatin over the exposure period in the low dose groups [117, 118], which contributes
to a non-linearity in the variation in viability with concentration that is difficult for
the PLSR algorithm to model.
the study demonstrates the potential of commercially available benchtop Raman microscopy for the examination and prediction of chemotherapeutic responses.
In general, for subcellular resolution, Raman spectroscopy is chosen over infrared spectroscopy due to the intrinsically higher spatial resolution. Furthermore, the
relative insensitivity to water renders live cell imaging of real time exposures a
possibility [119]. Nonlinear optical imaging techniques [120] promise even higher
Fig. 13.12 Calibration (a), and test set performance (b), in prediction with PLSR of the cell viability using Raman spectra of the nucleus of A549 cells. Root mean squared errors of calibration
(RmSEC) and prediction (RmSEP) are in units of cell viability, which themselves are normalized
to the level in the control. (Reproduced from [98])