

376
H. J. Byrne et al.
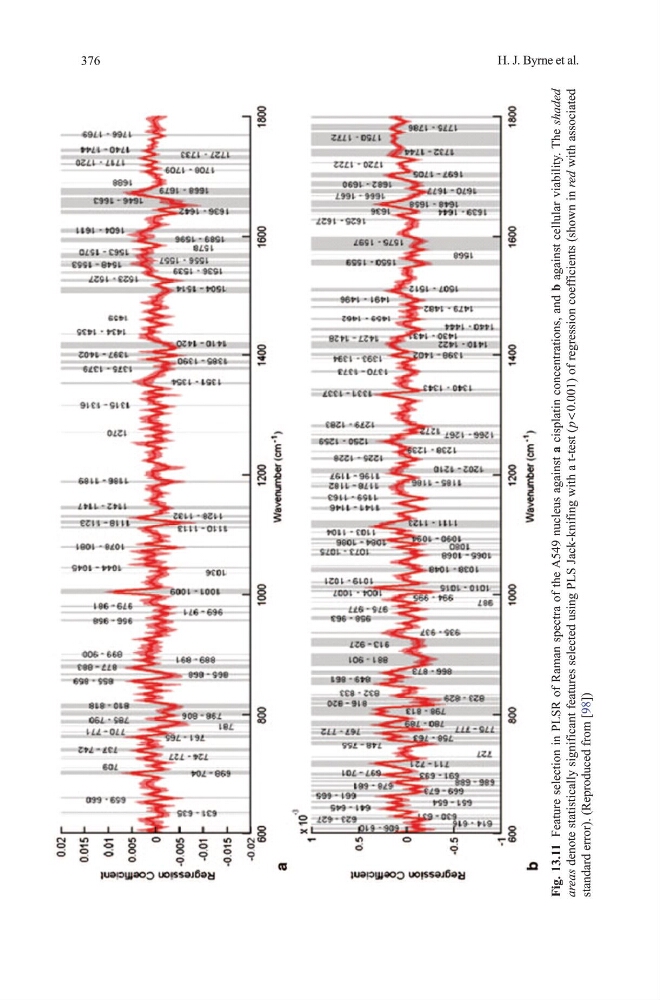
Fig. 13.11 Feature selection in PLSR of Raman spectra of the A549 nucleus against a cisplatin concentrations, and b against cellular viability. the shaded
areas denote statistically significant features selected using PLS Jack-knifing with a t-test ( p <
0.001) of regression coefficients (shown in red with associated
standard error). (Reproduced from [98])
H. J. Byrne et al.
Fig. 13.11 Feature selection in PLSR of Raman spectra of the A549 nucleus against a cisplatin concentrations, and b against cellular viability. the shaded
areas denote statistically significant features selected using PLS Jack-knifing with a t-test ( p <
0.001) of regression coefficients (shown in red with associated
standard error). (Reproduced from [98])